Download

1 / 14
140 likes | 214 Views
2.2 Determining and Using Normal Distributions. So, what if you have got some data…. And, you want to know if it is essentially normally distributed… 1. WHY WOULD WE WANT TO KNOW THAT??

E N D
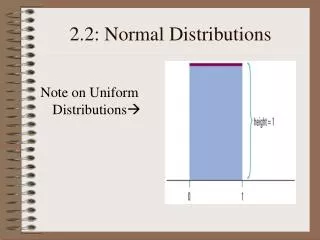
So, what if you have got some data… • And, you want to know if it is essentially normally distributed… 1. WHY WOULD WE WANT TO KNOW THAT?? • Because if it is, then we can approximate proportions between values using the normal table or normal calculator function! 2. Okay, maybe that might be useful. So how do we decide?
Normal Probability Plot!! • What? • A plot made by looking at how data points are spread out… do they pretty much follow the 68-95-99.7 rule? • If so, your Normal Probability Plot should look linear. • If not approximately normally distributed it won’t look linear. • How? • Enter data in L1 • In StatPlot choose the very last picture– the one that looks like a line, tell it where your data is stored (ie L1), choose ‘X’ and any mark you would like. • Graph with ZoomStat.
Deciding on normality… • Best way- Normality Plot OTHER WAYS TO HELP SUPPORT NORMALITY: • See if it follows the 68-95-99.7 rule using the standard deviation and the mean • Look at the data to see if it is roughly symmetric (box plot, histogram) • Are the mean and median about the same?
To find normal areas using calculator: • Press 2nd VARS (DISTR) • Choose the 2nd option • normalcdf( • Complete the command • normalcdf(lower x, upper x, , ) or • normalcdf(lower z, upper z) • For infinity, use 1EE99 • EE is above the comma. To type EE, type 2nd comma
Using the Calculator instead of table A. • Find the proportions of observations from standard normal distributions for • Find the proportions of observations below 20 given N(15,2) • WHY ARE THEY THE SAME????
To find normal proportions given observed variable: • State problem, draw sketch. • Standardize x using z =(x-)/. • Use the table. (Note if you are finding area to left or area to right.) OR • Use the calculator NormCfd(lower z , upper z) = area • Write conclusion in context of problem. • A z-score outside the range of table A can be considered essentially 0 since the area of the last entry is .002. Anything beyond that will continue to decrease and is insignificant BUT NOT ZERO (close to zero, essentially zero, but not equal to zero). SHOW YOUR WORK!!
Let’s try one together! #1 • According to the children’s growth chart that doctors use as a reference, the heights of two-year-old boys is normally distributed with a mean of 34.5 inches and a standard deviation of 1.3 inches. If a two year old boy is selected at random, what is the probability that he will be between 32.5 and 36.5 inches tall?
Answer: • Draw distribution and shade. • Show calculation. If you use the Calculator show what you entered. • Write an final sentence. • EX: Distribution on the board. Normcdf(32.5, 36.5, 34.5, 1.3)= .8764 There is an 88% chance that a 2 year-old boy will be between the height of 32.5 and 36.5 inches.
To find x-value given normal proportion • State problem, draw sketch. • Use table. (Locate entry closest to given % and find corresponding z-score.) OR • Use Calculator Function InvNorm(% written as a decimal) = z score • Un-standardize the value using z =(x-)/. • Write conclusion in context of problem. SHOW YOUR WORK!!
InvNorm(%/100) = z!! • Type 2nd Vars • Go to 3: InvNorm( • Type in the percentile (% below) as a decimal • This is the z-score associated with this percentile.
Let’s try another! #2 • According to government reports the heights of adult male residents in the US is approximately normal distributed with a mean of 69.0 inches and a standard deviation of 2.8 inches. If a clothing manufacturer wants to limit his market to the central 80% of adult males, what range of heights should be targeted?
Answer: • Draw distribution and shade. Determine the percent of the part you want. • Show calculation. If you use the Calculator show what you entered. • Write an final sentence. • EX: Distribution on the board. • We want to find the z-scores associated with z<a=.1 and z<b=.9. Use the tables or Calculator to find the z-scores. a=-1.28 and b=1.28. • Un-standardize the value using z =(x-)/ • 80% of the male population are between the heights of 72.6 and 65.4 inches.
HW: • DO # 30, 31, 33, 35, 38, 40, 44, 45, 47, 49 • Show all calculations and make sure you write you answers contextually with meaning. • Test on Fri 9/17 and Mon 9/20 • Fill in toolkit.