Download
1 / 1
10 likes | 129 Views
Daniel Ebeling 1 , Jarrod Erbe 2 , Abby Kroken 2 , Jeffrey Potratz 1 , Angela Majeskie 2 and Joel Davis 1 , (1)Chemistry (2)Biology Wisconsin Lutheran College, Milwaukee, WI. http://www.upenn.edu/pennnews/photos/704/mice.jpg. Abstract

E N D
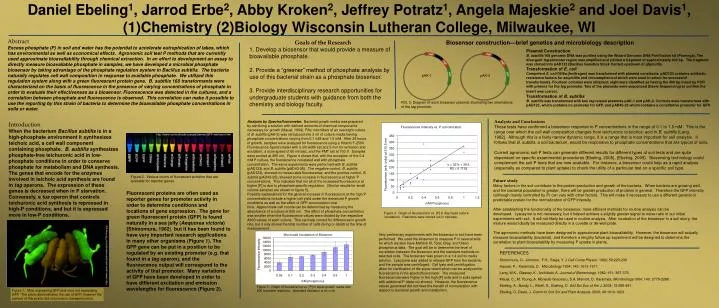
Daniel Ebeling1, Jarrod Erbe2, Abby Kroken2, Jeffrey Potratz1, Angela Majeskie2 and Joel Davis1, (1)Chemistry (2)Biology Wisconsin Lutheran College, Milwaukee, WI http://www.upenn.edu/pennnews/photos/704/mice.jpg Abstract Excess phosphate (P) in soil and water has the potential to accelerate eutrophication of lakes, which has environmental as well as economical effects. Agronomic soil test P methods that are currently used approximate bioavailability through chemical extraction. In an effort to development an assay to directly measure bioavailable phosphate in samples, we have developed a microbial phosphate biosensor by taking advantage of the phosphate regulation system in Bacillus subtilis. The bacteria naturally regulates cell wall composition in response to available phosphate. We utilized this regulation system along with a green fluorescent protein gene. B. subtilis 168 transformants were characterized on the basis of fluorescence in the presence of varying concentrations of phosphate in order to evaluate their effectiveness as a biosensor. Fluorescence was detected in the cultures, and a correlation between phosphate and fluorescence is observed. This correlation can make it possible to use the reporting by this strain of bacteria to determine the bioavailable phosphate concentrations in soils or water. Goals of the Research 1. Develop a biosensor that would provide a measure of bioavailable phosphate. 2. Provide a “greener” method of phosphate analysis by use of this bacterial strain as a phosphate biosensor. 3. Provide interdisciplinary research opportunities for undergraduate students with guidance from both the chemistry and biology faculty. Biosensor construction—brief genetics and microbiology description Plasmid Construction B. subtilis 168 genomic DNA was purified using the Wizard Genomic DNA Purification kit (Promega). The divergent tag promoter region was amplified and yielded a fragment of approximately 400 bp. The fragment was cloned into pAD123 (Bacillus Genetics Stock Center) upstream of gfpmut3a. Transformation of E. coli Competent E. coli DH5α (Invitrogen) was transformed with plasmid constructs. pAD123 contains antibiotic resistance factors for ampicillin and chloramphenicol which were used to select for successful transformants. Fourteen colonies were obtained; eight were identified as having the 400 bp insert by PCR with primers for the tag promoter. Two of the plasmids were sequenced (Davis Sequencing) to confirm the insert was correct. Transformation of B. subtilis B. subtilis was transformed with two tag related plasmids pAK-1 and pAK-2. Controls were transformed with pAD123, which contains no promoter for GFP, and pAD45-23 which contains a constitutive promoter for GFP. pAK-1 pAK-2 FIG. 3. Diagram of each biosensor plasmid, illustrating two orientations of the tag promoter. Analysis and Conclusions These tests have confirmed a biosensor response to P concentrations in the range of 0.1 to 1.5 mM. This is the range over which the cell wall composition changes from teichuronic to teichoic acid in B. subtilis {Lang, 1982}. Although this is a fairly narrow dynamic range, it is a range that is most important for soil analysis. It follows that B. subtilis, a soil bacterium, would be responsive to phosphate concentrations that are typical of soils. Current agronomic soil-P tests can generate different results for different types of soil tests and are quite dependant on specific experimental procedures {Ebeling, 2008}, {Ebeling, 2009}. Biosensing technology could complement the soil-P tests that are now available. For instance, a biosensor could help as a rapid analysis (especially as compared to plant uptake) to check the utility of a particular test on a specific soil type. Analysis by Spectrofluorometer. Bacterial growth media was prepared by sterilizing a solution with defined amounts of chemical components necessary for growth {Mauel, 1994}. Fifty microliters of an overnight culture of B. subtilis (pAK-2) was introduced into 3 ml of culture media having phosphate concentrations varying from 0.1 mM and 1.0 mM. After 24 hours of growth, samples were analyzed for fluorescence using a Hitachi F-2500 Fluorescence Spectrometer with a slit width set at 2.5 mm for emission and excitation, a scan speed of 60 nm/sec, and the PMT set at 700 V. Samples were excited at 495 nm. Figure 4 shows that, with the exception of the 0.4 mM P culture, the fluorescence correlated well with phosphate concentration. The same experiments were performed with B. subtilis (pAD123) and B. subtilis (pAD43-25). The negative control, B. subtilis (pAD123), showed no measurable fluorescence, and the positive control, B. subtilis (pAD43-25), showed some increase in fluorescence at higher P concentrations. This indicates that not all of the increased fluorescence at higher [P] is due to phosphate specific regulation. (Similar results for small volume samples are shown in figure 5). Possible explanations for the general increase in fluorescence at the high P concentrations include a higher cell yield under the enhanced P growth conditions as well as the effect of GFP accumulation over time. Approximate cell counts can be determined by measuring the absorbance of a culture at 600 nm. The effect of phosphate concentration was smaller when the fluorescence values were divided by the respective A600 values of each culture. This can help correct for differences in growth rate, but it only shows the total number of cells (living or dead) at the time of measurement. Introduction When the bacterium Bacillus subtilis is in a high-phosphate environment it synthesizes teichoic acid, a cell wall component containing phosphate. B. subtilis synthesizes phosphate-free teichuronic acid in low-phosphate conditions in order to conserve phosphate for metabolism and DNA synthesis. The genes that encode for the enzymes involved in teichoic acid synthesis are found in tag operons. The expression of these genes is decreased when in P starvation. Conversely, a tua operon that controls teichuronic acid synthesis is repressed in high-P conditions, and but it is expressed more in low-P conditions. http://www.conncoll.edu/ccacad/zimmer/GFP-ww/tsien.html Figure 2. Various colors of fluorescent proteins that are available for reporter genes. Future study Many factors in the soil contribute to the protein production and growth of the bacteria. When bacteria are growing well, and the bacterial population is greater, there will be greater production of proteins in general. Therefore the GFP intensity (although mainly controlled by P) can vary with other factors. This will make it necessary to use a different general or predictable protein for the normalization of GFP intensity. After establishing the functionality of the biosensor, more efficient methods for routine analysis can be developed. Lysosyme is not necessary, but it helped achieve a slightly greater signal to noise ratio in our initial experiments with soil. It will not likely be used in routine analysis. After incubation of the biosensor in a soil slurry, the mixture would ideally be measured directly in a cuvette or 96-well plate. The agronomic methods have been designed to approximate plant bioavailability. However, the biosensor will actually measure bioavailability (bacterial), and therefore a lengthy follow up experiment will be designed to determine the correlation to plant bioavailability by measuring P uptake in plants. Fluorescent proteins are often used as reporter genes for promoter activity in order to determine conditions and locations of gene expression. The gene for green fluorescent protein (GFP) is found naturally in a sea jelly (Aequorea victoria) {Shimomura, 1962}, but it has been found to have very important research applications in many other organisms (Figure 1). The GFP gene can be put in a position to be regulated by an existing promoter (e.g. that found in a tag operon), and the fluorescence output will correspond to the activity of that promoter. Many variations of GFP have been developed in order to have different excitation and emission wavelengths for fluorescence (Figure 2). Figure 4. Graph of fluorescence vs. [P] (1 day liquid culture incubation). Reactions were carried out in triplicate. Very preliminary experiments with the biosensor in soil have been performed. We used the biosensor to measure P in several soils for which we also have Mehlich III, Total, Bray, and Olsen phosphorus data. The goal will be to determine the level of correlation between the biosensor and the standard methods on selected soils. The biosensor was grown in a 1:4 soil to media solution. Lysozyme was added to release GFP from the bacteria, and the sample was centrifuged. Cell lysis and centrifugation allow for clarification of the supernatant which can be analyzed for fluorescence in the spectrofluorometer. The measured fluorescences were higher in the high [P] soils and in soils spiked with additional P (data not shown). However, the fluorescence values generated did not have the benefit of normalization with respect to bacterial growth and metabolism. REFERENCES Shimomura, O., Johnson, F.H., Saiga, Y. J Cell Comp Physiol. 1962; 59:223-239 Hauser, P., Karamata, D. Microbiology 1994;140: 1613-1617. Lang, W.K., Glassey, K., Archibald, A. Journal of Bacteriology. 1982; 151: 367-375. Mauel, C., M. Young, A. Monsutti-Grecescu, S.A. Marriott, D. Karamata. Microbiology.1994; 140: 2779-2288. Ebeling, A., Bundy, L., Kittell, A., Ebeling, D. Soil Sci Soc of Am J. 2008;72:985-991. Ebeling, D, Davis, J. Comm In Soil Sci and Plant Analysis. 2009;40:1610-1623. Figure 5. Graph of fluorescence vs. [P] in liquid growth media with 200 microliter reactions. (standard deviation is for n=8) Figure 1. Mice expressing GFP and mice not expressing GFP. The photo demonstrates the use of GFP, however the authors of this poster did not produce transgenic mice.