Download
1 / 17
170 likes | 261 Views
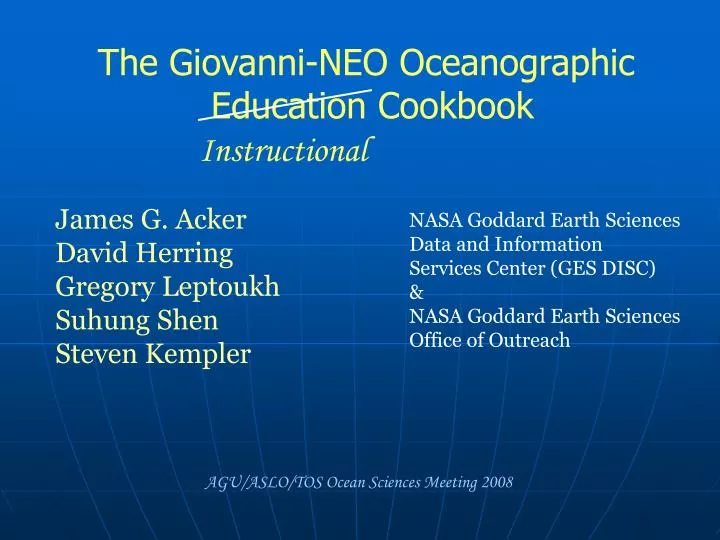
The Giovanni-NEO Oceanographic Education Cookbook. Instructional. James G. Acker David Herring Gregory Leptoukh Suhung Shen Steven Kempler. NASA Goddard Earth Sciences Data and Information Services Center (GES DISC) & NASA Goddard Earth Sciences Office of Outreach.

E N D
The Giovanni-NEO Oceanographic Education Cookbook Instructional James G. Acker David Herring Gregory Leptoukh Suhung Shen Steven Kempler NASA Goddard Earth Sciences Data and Information Services Center (GES DISC) & NASA Goddard Earth Sciences Office of Outreach AGU/ASLO/TOS Ocean Sciences Meeting 2008
Motivation The GES DISC and the Earth Sciences Division Office of Outreach have created two powerful online data analysis tools that can be applied to remote sensing data … using nothing more than a Web browser! Our motivation is to facilitate the use of these tools by educators (and students), and also by the scientifically-minded public
Giovanni:GES DISC Interactive Online Visualization ANd aNalysis Infrastructure • The main components of Giovanni are: • interactive map for region-of-interest selection; • menu of available data products; • calendar menu for time-period selection; • menu of visualization options; • visualization-specific options (color palette, axis values); • menu of output options
Hövmoller plots Area plot Animationsdisplay successive area plots Time - series Overlay Plots
X-Y scatter plots (here, SST vs. chlorophyll) Multiple data product time-series (here, SST vs. chlorophyll, in a Giovanni output figure adapted for publication)
NEONASA Earth Observations • The main components of NEO are: • Data file selection interface – global, multiple datasets • Search interface • ICE (Image Composite Editor) which allows: • True-color & false color composites • Scatter plots or graphs of transects • Histogram analyses • Probe function: find unit values and lat-lon info per pixel • Animate time-series images • Perform math functions • Zoom & pan • Assign color palettes
Examples of NEO visualizations Scatter Plot Transect Plot Histogram
Sometimes these lesson plans are a less-than-perfect fit for what’s being taught Philosophy Many educational and scientific organizations have created excellent, sophisticated “end-to-end” lesson plans using remote-sensing data Our philosophy is to provide educators* with a “pick-and-choose” resource that can be easily integrated into existing lesson plans or courses of instruction – which will also foster skill building with the Giovanni and NEO tools * and the public, providing informal environmental research and education
Surmounting the barrier of established curricula in classroom instruction! Skilled researchers and teachers who have taught courses for many years know what works, and they cover the material they have determined to be necessary. Adding something “new” like Giovanni and NEO usually requires replacing an instructional element that has functioned well with something as good – preferably better. AND it should be easy for them to do that!!
Question: What is needed to facilitate Giovanni and NEO implementation in oceanographic education? Answer: A cookbook – providing “recipes” for the investigation of a multitude of regions and oceanographic processes. A skilled chef – the classroom instructor – can select the appropriate recipes which satisfy the educational requirements of a particular course. A recipe would indicate the data products, visualizations, regions, time periods, etc. to produce the desired output – which the student interprets.
Components of the Giovanni-NEO Instructional Cookbook • Introduction How to use it; what the data products mean; what scientists are interested in; data quality concerns • Functions Instructions on creating the basic visualizations and analyses in Giovanni and NEO • Recipes! Step-by-step presentations for creating visualizations and analyses appropriate for region or topic - EXPANDABLE • Additional Information Resources (“high-quality” links) providing investigational opportunities, expanding the range of knowledge
Organization Each recipe chapter will be organized as Local – Regional – Global topics. This organizational strategy facilitates connectivity between the observing environment of the users (teachers/students/public) with the larger-scale “view from space” provided by remote sensing data
Example: East Australia Current Location Guide The Introduction to each recipe states which data sets and visualizations will be used, and provides a visual and numerical (lat/lon) location guide
Example: East Australia Current Giovanni area plots of Sea Surface Temperature and Chlorophyll Concentration Chlorophyll Concentration plot utilizes the Customized Color Scale option
Example: East Australia Current NEO: Side-by-side chlorophyll and sea surface temperature transect analysis Transect plots show fronts and eddies clearly EAC Front Northern eddy Southern eddy Java applet allows interactive transect plot drawing
Development Plan • The current Giovanni-NEO oceanographic instructional cookbook is a demonstration prototype • A workshop (April-May) at GSFC will refine the concept and objectives; attendees will be scientists, data specialists, formal and informal educators • The cookbook will be expanded into multiple discipline areas
Take a look! http://disc.sci.gsfc.nasa.gov/ oceancolor/locus/ Giovanni_NEO_cookbook_Introduction.shtml OR just Google “Laboratory for Ocean Color Users” ! Feedback and comments welcome: jim.acker@nasa.gov Thanks for listening!