Download
1 / 29
290 likes | 453 Views
AOGS 2011 Taipei International Convention Center. Long-term variability of the Kuroshio Transport East of Taiwan and the climate it conveys. Mao-Lin Shen 1 E-mail: earnestshen@gmail.com Yu-Heng Tseng 1 , Sen Jan 2 , Chih-Chieh Young 1 , Ming-Da Chiou 2.

E N D
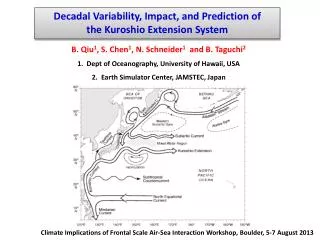
AOGS 2011 Taipei International Convention Center Long-term variability of the Kuroshio Transport East of Taiwan and the climate it conveys Mao-Lin Shen1 E-mail: earnestshen@gmail.com Yu-Heng Tseng1, Sen Jan2, Chih-Chieh Young1, Ming-Da Chiou2 1Atmospheric Sciences, Nation Taiwan University, Taiwan (R.O.C.) 2Institute of Oceanography, Nation Taiwan University, Taiwan (R.O.C.) August 31, 2014
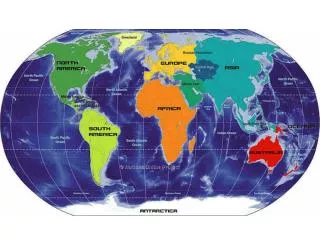
Heat Exchange between Tropics and Extratropics Kuroshio [Daifang and Philander, 1994, Science]
North Equatorial Current-Mindanao Current-Kuroshio (NMK) Current System (a) 20 Sep, 1987 (b) 23 April, 1988 Fig. NEC bifurcation near the Philippine Coast. NEC flow poleward of this latitude turned north as the Kuroshio while flow to the south fed the Mindanao Current. [Toole et al., 1990, JPO]
ENSO and NEC [Qiu and Chen, 2010b, JPO]
[Qiu and Chen, 2010b, JPO] • North Equatorial Current bifurcation (NECB) • Zonally distributed wind stress curl
Things we already known • Why does the Kuroshio Transport on Luzon Strait and northeast of Taiwan present different patterns [Hwang and Kao, 2002, GJI] ?
NEC AVISO SLP + MDT (1996~2001) (cm) STCC
Subtropical STCC NEC Tropical Possible Source of the KT West Pacific pattern ENSO [Vianna and Menezes, 2010, JGR]
Questions will be answered • How to identify and estimate the Kuroshio Transport reasonably? • What is the origin/source of Kuroshio if Section PCM-1 is focused? (suggesting the possible climate variability conveyed by Kuroshio Transport) • Is our hypothesis correct?
Methods for obtaining the KT Geostrophic Relationship (GR) Considering the geostrophic balance is prevailing. Empirical Relationship (ER) The relation built by linear curve fitting. Transfer Function (TF) A spectral relationship of the KT and the associated SSH different. 2014/8/31
Modeled SSH on day 180, Year 37 Geostrophic Balance Model Results Taiwan Multi-scale Community Ocean Model (TIMCOM) The frequency‐dependent “transfer function” [Åström and Murray, 2008] estimates the linear causal relationship between any pair of variables. (c)
AVISO SSH Geostrophic Balance Observation (c) (d) KT on PCM-1 Section (Johns et al., 2001)
Re-constructed KT Interannual variation Seasonal variation
KT vs. -WP KT vs. ENSO
Subtropical STCC NEC Tropical Possible Source of the KT West Pacific pattern ENSO [Vianna and Menezes, 2010, JGR]
Huge NEC transport Limit NEC transport mean std Different KT Phases mean std mean std
Conclusions • The re-constructed KT obtained by GR and TF shows good agreement with the modeled ten-year KT. • Using a longer period of observation data, the TF can provide a very good view on the relationship between the KT and the associated SSH difference and minimize uncertainty. • The GR can be applied only when the focused period is longer than 4 months (low frequency) and is good to obtain the long-term KT variability.
Conclusions • The annual-averaged KT on Section PCM-1 was controlled by the northern branch of the NEC and mesoscale eddies generated from the STCC while the NEC is strongly influenced by the ENSO events, and the mesoscale eddies are related with the WP pattern. • Future works • The heat transport from tropical to extratropical via KT have to be determined. (The knowledge of thermocline variation is necessary.)
Thank you for your attention. Questions? 2014/8/31
STCC [Qiu and Chen, 2010a, JPO] • STCC, subtropical countercurrent • Ekman convergence forcing, which associated with meridional temperature gradient and zonal geostrophic velocity
[Qiu and Chen, 2010a, JPO] Fig. Comparison between the interannually-varying Ekman forcing term and the interannually-varying EKE time series in the STCC band.
Can sea surface height be used to estimate oceanic transport variability? • Ivchenko et al. (2011), GRL, 38, L11601. • The relation between the sea surface height and the meridional transport across a zonal section at 26.5°N in the North Atlantic
Numerical model Surface sources of heat and fresh water Levitus94 seasonal climatology Bathymetry unfiltered ETOPO-2 depth data supplemented with the Taiwan’s NCOR 1-minute high accuracy depth archive in the Asian Seas Winds stress monthly Hellerman and Rosenstein winds stress Vertical mixing Modified Richardson number dependent formula based on Pacanowski and Philander (1981) 2014/8/31
Model validation Fig. Comparison of SSH and the cross-section velocity on Section PCM-1. [Tseng et al., 2011, PO] 2014/8/31
Fig. TIMCOM output and the schematic of the western North Pacific current system. Annual mean has been taken.
PCM-1 NEC contributed • Streamfunction of annual-averaged model results (Sv) • (0-800 m) • Ratio: • NEC:PCM-1 • 1:2.1978