Download
1 / 28
280 likes | 390 Views
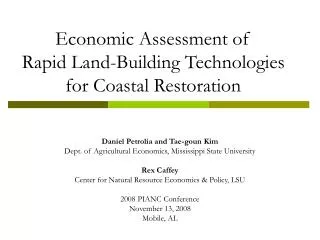
A c omparative economic assessment of dredge- and diversion-based land building CPRA Board April 16, 2014 Baton Rouge , LA.

E N D
A comparative economic assessment of dredge- and diversion-based land building CPRA BoardApril 16, 2014 Baton Rouge, LA Rex H. Caffey1, Hua Wang2, Daniel Petrolia31Professor /Director and 2Graduate Research Assistant Center for Natural Resource Economics & PolicyLSU AgCenter and Louisiana Sea Grant 3Associate Professor, Center for Natural Resource Economics & PolicyDept. of Ag. Economics, Mississippi State University
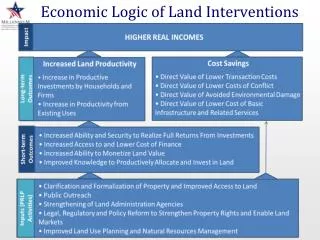
“Economics” is the study of how limited or scarceresourcesare allocatedamongst competing needs.
Benefit-Cost Analysis vs. Cost Efficacy TotalBenefits ($) B:C Ratio ≥ 1.0 = Total Costs ($) TotalCosts ($) C:E Ratio = Benefits (Resource Units)
Efficiency as a Primary Criteria? • “...coastal wetland restoration projects in Louisiana (will) provide for the long-term conservation of such wetlands... based on the cost-effectiveness of such projects in creating, restoring, protecting, or enhancing coastal wetlands...” • (1990 - Public Law 646: CWPPRA, Sec. 3952 1(b)).
Cumulative Wetland Loss not significant Population not significant Total Area of Project not significant Pr.>z; (=0.05) Variable Rapid-Land Building Projects (MC) significant (+) Cost ($/AAHU) Years 1-5 significant (-) Total Cost of Project (FFC) significant (-) Cost ($/AAHU) Years 10-15 significant (+) Is cost-efficacy driving project selection? (C. Aust2006, Merino et al. 2011) • “Candidate Selection Model” using CWPPRA nominee data • Binary Logit, 1991-2001, n=350 • Probability of Selection = f{CE, Total Cost, Size, Type, Pop, etc.)
An Evolving Benefits Construct Pre 2005: Restoration was “habitat-driven”under CWPPRA with a standard efficiency metric ($ per AAHU) Katrina changed things... scale of the crisis is much greater than originally thought The integration of coastal protection andrestoration has shiftedthe definition of benefits Post 2005: Emergence of a “land-building” focus has fueled scientific/ideological debate over competing methods ($/acre)
Terminal Stocks vs. Aggregate FlowsHow do MC and DIV projects compare? MC DIV Acres Acres 50 50 Years Years
Freshwater/Sediment Diversions “Although this technique helps protect and sustain existing wetlands, it could take decades for new land to be built with new diversions alone.” – CPRA Master Plan (2007) Tradeoff: Do the benefits of this more “natural” method outweigh the risks of waiting for this land to be restored?
Rapid Land Building (Marsh Creation) “Pumping sediments…can build marsh quickly…(but) wetlands built via pipeline may not function in the same ways as wetlands built through natural processes…(and) pumping in sediment is expensive…” – CPRA Master Plan 2007 Tradeoff: Does the risk reduction by moving benefits up in time outweigh the potentially “higher costs” of this technology?
Objectives(Caffey and Petrolia – CREST 2008)(Caffey, Wang, and Petrolia 2011) • Construct generic benefit trajectories and generic cost models for each project type • Develop break-even derivations via ecosystem-service-flow based benefit-cost analysis • Conduct sensitivity analyses using risk-adjusted case studies to illustrate trade-offs
Data and Methods Data: - CWPPRA, CIAP, LCA,WRDA, STATE (prior to 2012) - Authorized projects and project bids (n=146) Methods: - Generic Benefit and Costs Models (regression, mass-balance)1. Dredge-based “Marsh Creation” (MC) 2. Diversion-based: - Fitted model from projections (DIV1) - Exogenous model: Boustany 2010 (DIV2) - Benefit-Cost Analysis • ESV derivedvia break-even sensitivity analysis • ESV specifiedfor case studies using benefits-transfer
T T bt (1+r)t t = 0 t = 0 = ct (1+r)t Benefit-Cost Analysis TotalAcreageBenefits($) B:C Ratio = Total Acreage Costs ($) B:C Ratio ≥ 1.0 ...where: b= $benefits (ESV), c= $costs, t = year, and r = discount rate
Target acreage Restoration (1-2 years) “Restoration Trajectory” (Percentage of Completion)TMC=1/(1+exp(-(t-0.96)/0.08)) R2=0.90 Time Lag Generic Benefit Modeling: Marsh Creation Projects (MC)
Target Acreage Restoration (20-50 years) “Restoration Trajectory”(Percentage of Completion)TDIV=-0.0029+0.0501*t R2=0.91 Time Lag Generic Benefit Modeling: Diversion Projects (DIV1)
DIV1 DIV1 DIV1 Unconstrained “Break-Even” AnalysisWhat are the annual ecosystem service values required for B:C=1.0? DIV2 DIV2 DIV2 MC MC MC Time (years) Scale (acres) DIV1 (fitted trajectory) DIV2 (Boustany 2010) Break-Even ($/acre/yr) MC Distance (miles) Discount (%) Break-Even ($/acre/yr)
Refining for Risks • Climatological Risks? • (MC and DIV projects) • Data: Hurricane Landfall Probabilities (Klotzbach and Gray 2011) • “Expected valuation” construct (will it hit? + will it not hit?) • What if it does hit? - Static vs. Dynamic impacts: (20-50% acreage loss) • Social OppositionRisks? • (DIV projects) • Data: Case Studies, operational regimes of diversions • What does history tell us about their operation? • How might location and scale affect flow? (25-80% of maxmimum)
Case Study Assumptions • Location: Upper and Lower Estuary • Project Types: MC and DIV2 • Project life time: 20 years and 50 years • Target scales: 1000 and 5000 acres • Time lag: 4 to 10 years • Land loss rates: 0.003 to 0.006 per year • Hurricane probability: 0.1 to 0.2, XHN • Diversion Type: Controlled • Diversion Flow: 0.25 to 0.80 of capacity • Mob/Demob Cost: $1,000,000 • Pumping Distance: 4 miles • Access Dredging: $600,000 • Construction Costs 85% • E&D cost 10% • O&M cost 5% • Ecosystem service values $4,410 per year (Surge, Habitat, W.Q.)
Results and Conclusions • Efficiency is relative: This analysis was “acreage-focused”with $-benefits expressed via ecosystem service values • Data is limited: Projectdata is sparse, variable, estimate-based • More confidence in MC estimates (some performance data) • Less confidence in DIV estimates (entirely projection-based) • Reality: Same project data available to state and feds. Refinement is needed, but not likely to change shape of restoration trajectories. • MC (rapid, sigmoid, subject to erosion) • DIV (slower, physical sustainability)
Results and Conclusions: Diversions Tradeoff: Do the benefits of this more “natural” method outweigh the risks of waiting for this land to be restored? • It depends…., but in our simulations, no. • Scale, Time, Location • B-C Ratios ranged from 0.2 to 3.95(<MC in all simulations) • Efficiency generally increases with scale and time • Slow rate of restoration is an economic and ecological disadvantage • Social “sustainability” is a major constraint • Limited locations for large-scale diversion • Additional costs must be addressed in middle/upper estuary • Opportunity cost of delay and/or flow constraint • Preemptive compensation?
Results and Conclusions: Marsh Creation Tradeoff: Does the risk reduction by moving benefits up in time outweigh the potentially “higher” costs of this technology? • It depends….but in our simulations, yes. • Scale, Time, Distance • B-C Ratios ranged from 1.03 to 7.61 (>DIV2 in all simulations) • Efficiency generally increases with scale. Breakeven cost curves for MC converged with DIV (unconstrained) at: • 4,000-10,000 ac, 25-35 yrs, 10-20 miles for DIV2 and DIV1, • But…with risks accounted for, convergence points increase. • “Apparent” high costs diminish under time and risk considerations • Rapid rate of restoration is an economic and ecological advantage
Master Plan Implications? Louisiana’s Comprehensive Master Plan for a Sustainable Coast (2012), Fig. 9. p 35
Conventional Wisdom on Diversions • Momentum towards large-scale diversions is grounded in… • the geologic history of coastal Louisiana • the predominance of biophysical sciences in restoration • ...but current assertions regarding the economic supremacy of diversion efficiency are only technically accurate if we… • assume the benefit projections for sediment diversions are mostly correct • assume the cost projections for sediment diversions are mostly correct • assume social/transition costs external to the project (or inconsequential) • assume “sustainability” is defined on biophysical terms only • assume diversion flow > 80% of design capacity (our study) • assume a diversion trajectory of a minimum of 50 years • assume diversion benefits > 17x projections (> ???X performance) • assume a discount rate of zero • assume an acre of wetland in 50 years is of equal value to an acre today • assume “$/acre” is a better metric than “BC ratio”
Take-Home Points • Our research is notintended as an argument for or against a particular method of restoration. DIV and MC projects are notinfinitely substitutable. • Our study indicates… • While the estimated costs of terminal stocks (i.e. acres) may indeed be higher for MC (~ 3x)… • …analysis of benefit flows (i.e. monetized ecosystem services) suggests that MC projects may achieve higher BC ratios (within a 50 year horizon) • “TrajectoryEconomics”- It’s not only important to address “how” we get the benefits, but also “when” we get the benefits. The operational definition of efficiencyneeds to be expanded from stocksto flows. • Future revisions needed to address projects of the scalein the SMP, but the generic shapeof these trajectories is not likely to change – and that shape has tremendous implications for the underlying economics.