Download
1 / 26
300 likes | 546 Views
Computer Applications for Business (11). Last week – successfully achieved: Wrap-up of Database work Completing Mail-Merge with Database data Mail-Merge with Spreadsheet data This week: Practice examinations http://www2.winchester.ac.uk/bm/courses/bs1904/index.html#exam

E N D
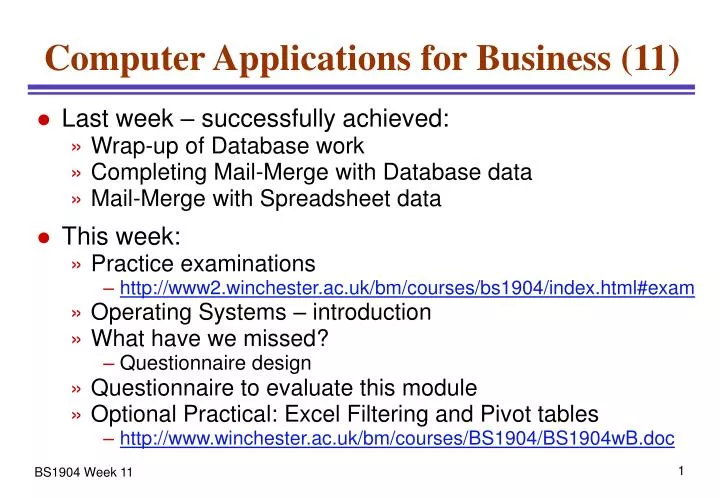
Computer Applications for Business (11) • Last week – successfully achieved: • Wrap-up of Database work • Completing Mail-Merge with Database data • Mail-Merge with Spreadsheet data • This week: • Practice examinations • http://www2.winchester.ac.uk/bm/courses/bs1904/index.html#exam • Operating Systems – introduction • What have we missed? • Questionnaire design • Questionnaire to evaluate this module • Optional Practical: Excel Filtering and Pivot tables • http://www.winchester.ac.uk/bm/courses/BS1904/BS1904wB.doc
So far we’ve covered: • Introduction to the role of IT in Business • Operational, Production, Decision-support • Communications and how to get your point across • Word-processing • Fonts, Styles, Spell-checkers, Tables • Spreadsheets • “What if” models, Excel functions, Graphical reporting • Composite documents – putting things together • Database • Purposes; types; flat file versus Relational databases • Mail-merge • Driving Word from databases, spreadsheets and tables • There’ll be more about managing Information in the degree, but this module is the last “skill-based” one Demonstrated in your assignment Exam
What Else do you Need? • Let’s try to list any areas omitted: • For example: • Graphics packages (CAD, image editors, Visio) • Multimedia – building/editing sound and movie clips • PC maintenance and enhancement • Fax • Statistical packages • Accounting packages • Other applications of what you already know • We’ll cover any burning issues next week
Operating Systems • What you actually see on a computer • Windows, MacOS, zOS, VMS, UNIX • Provide the building blocks of complex systems • Common functions encapsulated • Microsoft (or Apple, or IBM) supplies code to drive disks, so application programmer doesn’t need to do it again • Controls the hardware of the computer • Application program instructs OS what to do(doesn’t have authority to drive hardware) • OS only performs valid actions • Makes the computer appear to do several things at once • Organizes saved data into files
Understanding Hardware • Most of our experience is of an Operating System, not a computer • True of Windows, MacOS, UNIX, VM... • Today’s Macs run on Intel hardware, like Windows • Need to think in lower-level terms to understand what’s really happening • Many things become clearer as a result • Problem is that you can’t easily start a PC without operating system • Even DOS hides files, output etc.
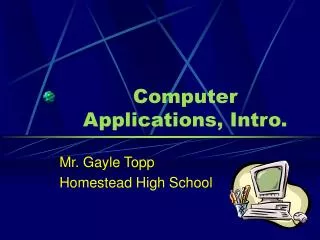
Modern Computer Architecture • Processor works on data in memory • Other data flows through the bus Memory Processor 1234567890-= QWERTYUIOP[]# ASDFGHJKL;’ ZXCVBNM,./ Output (Information) Input (Data) Bus Other long-term Storage Disk Storage
In the beginning machine code(1948 to around 1950) Then Assemblers developed translate 1:1 into machine code Processor-dependent As complex as the processor (at least) Still in use today We used to include some of this in the module, to get students to understand what tiny things a computer does High-level compiled languages (from 1956) Processor-independent FORTRAN, Cobol, ALGOL, Pascal, C , PL/I Interpreted languages from late 1960s Basic, APL, REXX Object-oriented Visual Basic, C++, Java Programming Languages
Input and Output (I/O) • Peripherals are much slower than CPU or memory • Programs would have to keep waiting if they output direct to printer, or even to disk • Best to write results into Buffers – bit of memory from where it will be copied to the output device • Stop processing every so often to copy some data • Today’s computers have special I/O processors • Separate dedicated processors that drive I/O devices and have Direct memory access (DMA) • CPU fires off the I/O processor, then goes back to work • Printing is so slow we do it via SPOOL • Program writes to disk, OS later copies to the printer
Operating Systems – Summary • Though the processor is simple and serial, we want to do more complex things, often several at once • An operating system is the program that: • Provides the building blocks of complex systems • Controls the hardware of the computer • Makes the computer appear to do several things at once • It goes round looking for work; keystrokes, mouse clicks... • It then does a bit of the required work, • then looks for other things to do, and so on • We say the machine is doing things “concurrently” – • they’re not simultaneous, but they look it! • Organizes saved data into files
Notes about the Examination • Entirely Practical • No printing: You’ll be given an exam account, and we will mark what you store in its “My Documents” • Accounts should be logged on when the exam starts • Make sure you can extract contents from a zip file • Timing • Scheduled to last 1 hour 45 minutes • Should be more than enough time to finish • 2-hour slot booked on exam timetable, because: • You get extra time if you suffer a computer crash (rare, but it does happen – make sure you keep saving) • May take longer than planned to log everybody on
Purpose of the Examination • Goal is to check that you’ve achieved the learning outcomes not tested by the assignment • Familiarity with the Windows environment • Styles and fields in Word • Using the Access database (queries and a simple report) • Combining data and text with Mail-Merge • Only 25% of the total assessment • Designed to be progressive • Several database examples, starting with very easy • But even so there’s “low hanging fruit” throughout,so don’t give up at the first thing you can’t do
Practice Exams • The real exam will be different, but on similar lines • For practising, work on your normal IT account • Find a practice paper at http://www2.winchester.ac.uk/bm/courses/bs1904/index.html#exam • Also helps you find the files referred to in the papers • Make sure you follow the instructions – remember: • Download materials in to My Documents (don’t open them) • Never edit anything inside a zip file • Always extract materials into a folder in My Documents • Keep saving your work • Close Access when you’ve finished making changes • That way it saves everything cleanly
Surveys Including feedback on modules
Surveying Opinions • Businesses need to know the opinions of: • Customers and prospective customers, for • Market research • Satisfaction and Quality assessment • Employees, for • Morale • Quality management • Need to: • Ask the right questions.. • ..of the right people • Also have to process their answers thoughtfully • Usually accomplished with a questionnaire
Questionnaire Design • Questionnaires have to: • Be Ethical: no impertinent questions; no risk to respondents • Engage support of respondents • Be easy to fill in • And be clear and free from accidental ambiguity • Match the way people think about the topic • Results will be used by the business • So conclusions should be clear • Respondents will also want to see the results (to encourage future support, or to enhance morale) • Specialized tools are available, but we can also: • Develop the questionnaire with word processor • Analyse and present results with a spreadsheet
Question Types • Matters of fact • Yes/No & other binary questions such as Male/Female • Numbers, selections from list, or values Demographic questions – facts about the respondent • Needed to analyse views of subsets of respondents“is popularity of deep-fried Mars bars highest in Scotland?” • Often involves putting oneself into a category • under 20 • 20-29 • 30-39 • 40 and over • Subjective views • Usually choosing points on a continuum of opinion
Demographic Questions • Some are very clear: • Age, sex, post-code • Others are much more difficult to pin down • What is the “principal job responsibility” of the head physics teacher – management, teaching, admin? • Does “income” include interest, spouse’s salary…? • Even clear questions may be impertinent or intrusive • Income, ethnic origin, political affiliations • Some options for question design: • Collect data (e.g. age) and divide into buckets later, or • Get respondent to choose a range (e.g. 45-54) • First is clearer and open to different analyses, but may be viewed as too intrusive
Question Clarity • Where you ask respondent to pick a category, think of logical way to list the categories: • Good Tick the box corresponding to your age under 20 20-29 30-39 40 and over • Bad Enter the number corresponding to your age 1. under 20 2. 20-29 3. 30-39 4. 40 and over
Some questions have more than one valid response, for example:Which of the following cereals do you eat in a typical week? Special K Rice Krispies Fibre 1 Corn Flakes Other branded cereal (Kellogg's, Nestle, Jordan’s) Supermarket or unbranded cereal Porridge To get the best responses, put most generic low in the list, otherwise people may tick general item before seeing the exact match May be interesting to get items listed in a sequence Put “1” by product you eat most often, “2” by next... Multiple Answers
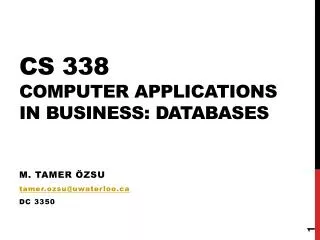
1 2 3 4 5 Verysatisfied Satisfied Neither satisfiednor dissatisfied Dissatisfied Verydissatisfied Opinions • People’s views form part of a continuum • Questionnaire should reflect this: • Try to make descriptions symmetrical: • Satisfied versus Dissatisfied • Agree versus Disagree (not “Oppose”) • Otherwise you’re biasing the way people respond • There’s a risk of respondents “sitting on the fence” • Counter this by having an even number of opinions – no middle choice
Be Consistent • If “1” is the most favourable response in one question, don’t make it the least favourable in another • May want to use letters where the values are reversed, e.g. How long does it take you to find your chosen cereal? A) Over 2 minutes B) 1-2 minutes C) Under a minute • Avoid numbers where there’s no sequence of goodness • for example: Do you think the pace of the course was: • Too slow • About right • Too fast
Word-processing the Survey • Devise a consistent set of styles for: • Question heading • Question text • The bit the respondent answers – there will probably be different styles for the various kinds of question, e.g. • Yes/No • Choosing from a list • Expressing an opinion (best to use a graphic) • Any explanatory text • Think about the respondent, not data-entry clerk • You can always provide an overlay for this purpose • Or have small codes by the choices
Data Analysis • Collect data for each respondent, for example in a database or spreadsheet • Decide on categories for analysis • Certainly analyse the “all-respondent” case • Plus any demographic splits (M/F, local/remote…) • Count responses for each part of each question • So if Q1 is a Y/N, count the number of Ys and Ns across the selected population • If it’s an opinion, count the 1s, 2s, … 5s over respondents • Display the counts as percentage of responses • Don’t be tempted to “average” numeric responses • 10 twos and 40 threes may be OK • 35 twos, 5 fours and 10 fives is not (still averages 2.8)
Displaying Results • Bar charts are clear but space-consuming • For discrete information, need separate bars • For Opinion/distribution data, stack the bars • Can save space by making the bars horizontal • Be consistent with colours and direction • e.g. Good on left in BlueBad on right in RedNeutral in middle and blank Pie-chart better here – why?
Next Week More exam practice Revision of entire course