Download
1 / 25
250 likes | 420 Views
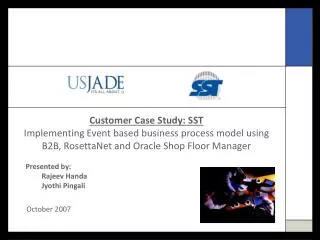
Customer Service Case Study Past and Present. Noel Landuyt The University of Texas at Austin Customer Service Symposium January 9, 2002. Survey of Organizational Excellence Group. Located at UT Austin Conduct the S.O.E.

E N D
Customer ServiceCase StudyPast and Present Noel Landuyt The University of Texas at Austin Customer Service Symposium January 9, 2002
Survey of Organizational Excellence Group • Located at UT Austin • Conduct the S.O.E. • Co-Sponsor the Governor’s Conference on Organizational Excellence (Texas Star)
Survey Cycle Participation Preparation Intervention Interpretation Administration
Participation • Designed a Sound Methodology • Understood TX Strategic Planning • Established relationship with LBB, Governor’s Office & Legislature • Had Credibility and Confidentiality • Provided More than Technical Administration • Familiar with Constraints of Public Organizations
Preparation • Identify Customers/Budget Strategy • Units on a 2 Year Survey Cycle • Custom Groups Established • Standard Items Groupings Selected • Custom Items Groupings Selected
UT (28 Units/Over 2 years) Admissions Athletics Distance Education Financial Services KUT Radio H.U.B. Rec. Sports Music Camps Various Special Events Centers Various Student Services Other Pilots Licensees Call-ins Visitors/Walk-ins Complaint Filers Regulated Applicants Clients Private Industry Partners Preparation: Units (some examples)
Preparation: New Survey Set-Up • Enter the System and set-up a new Survey
Preparation: New Survey Interface • Graphical Interfaces
Preparation: New Survey Custom Groups • Establish Custom Groupings
Why did you interact with organization? Compliance inspection Obtain licensing information Participant in specific program or service What type of “customer”? Student Client Applicant Open to any Category Type Preparation: New Survey Custom Group Examples
Data Analysis Results returned in Five Construct Areas Designed to Meet SB 1563 See Handout Preparation: New Survey Standard Items
Preparation: New Survey Standard Items • Selection from standard items • Allows for comparability (UT Example)
Every Organization is different. Custom items grouped together Items specific to a program or service (food service delivery different from health service delivery) Items specific to a customer group Preparation: New Survey Custom Items
Preparation: New Survey Custom Areas • System designed for 3 additional areas.
Preparation: New Survey Custom Items • Custom items for custom areas.
Administration • Web based • Mail • Point of Service • Telephone
Administration: Web Based • Custom Email (similar to SOE) • Link from your website • Accessible via URL • Newsletter, notices, letters • Features (Video Pop-up, custom contact, graphics) • TEA, UT, PUC, TDED, TRC examples.
Administration: Mail • Same content as web version • Optical Mark Recognition • Business Reply • State rate postage • UT has mail, duplicating, and scanning facilities.
Administration: P.O.S. & Phone • Point of Service Surveys • Telephone Center
Interpretation • Data returned in numeric and graphic formats. • Data returned on all custom groupings to allow for internal comparison. • Benchmark data returned with reports for external comparisons. • Overtime data provided. • Executive summary analysis data returned.
Interpretation: Numerical Data • Data returned in Excel for Sorting • Data returned in paper reports. • Numerical Analysis on Construct and Item level. • Item Analysis: standard deviations, frequency counts and means. • As available overtime and benchmark data.
Interventions • Best Practices web posting • Resource for student internships in Social Work, MIS & MBA. • Resources in Communication, Business, Public Affairs, Social Work & Governor’s Center.