Download
1 / 62
640 likes | 1.23k Views
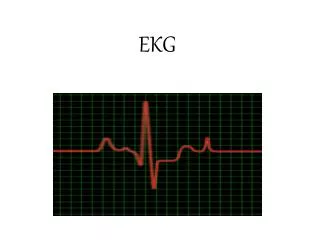
EKG. Mike Clark, M.D. Topics . What is an EKG What is the Lead System The EKG paper EKG mounting Standard EKG waves and segments Interpretation of EKG Cardiac Stress Test Thallium scan versus Technetium scan Myocardial Infarction (Heart Attack) EKG Cardiac Monitoring .

E N D
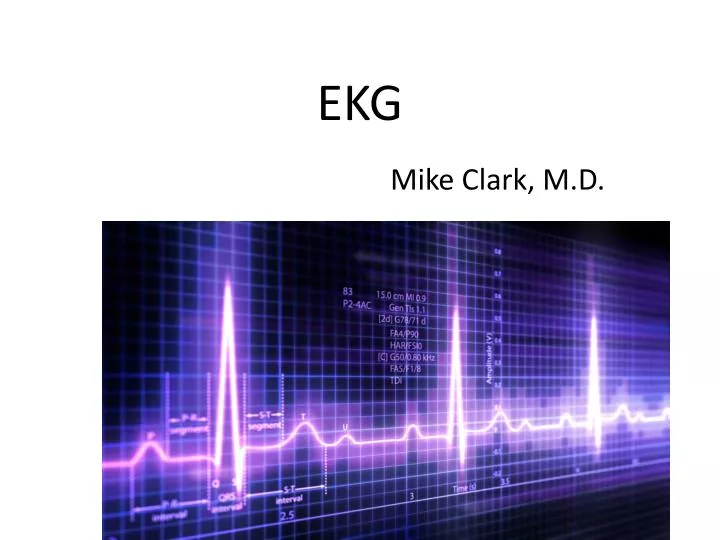
EKG Mike Clark, M.D.
Topics • What is an EKG • What is the Lead System • The EKG paper • EKG mounting • Standard EKG waves and segments • Interpretation of EKG • Cardiac Stress Test • Thallium scan versus Technetium scan • Myocardial Infarction (Heart Attack) • EKG Cardiac Monitoring
An EKG only measures the Charge Activity of the Heart The EKG monitors and measures the charge activity of the heart. Muscle has the properties of charge movement and contraction- the EKG only evaluates the charge movement activities of heart muscle and conduction system cells. . The actual contraction is monitored using other diagnostic devices.
Sensors are placed on the skin to monitor the charge activities of the heart. The sensors are electrodes that measure the charge movements (action potentials). • The electrodes form the Lead system used in electrocardiography. • Since the Leads are placed on the chest wall and not directly in the heart muscles or conduction system cells- evaluation of the heart activity is at a distance. • Whenever an activity is observed from a distance - complete evaluation requires observations from many different viewing locations. This is the case of the EKG- numerous leads (sensors) must be placed on the skin to observe the multitude of charges coursing through the millions of muscle cells and conduction cells all around and through the heart. The standard evaluative EKG has 12 Leads.
Lead System • The standard EKG for diagnostic interpretation has 12 leads termed I, II, III, AVR, AVL, AVF, V1, V2, V3, V4, V5 and V6. Monitoring EKGs generally only use 3 leads. • Leads I, II, and III are considered bipolar leads in that they detect a change in electric potential between two points. • Leads AVR, AVL, AVF, V1, V2, V3, V4, V5 and V6 are considered unipolar leads in that they measure the electric potential at one point with respect to a null point (one which doesn’t register any significant variation in electric potential). • The right leg electrode always acts as a ground electrode. The acts in protection and to eliminate some background electrical interference.
Lead Iis between the right arm and left arm electrodes, the left arm being positive. • Lead II is between the right arm and left leg electrodes, the left leg being positive. • Lead IIIis between the left arm and left leg electrodes, the left leg again being positive. Remember the right leg electrode always acts as a ground electrode. It acts as a backup to keep the patient from getting an electrical shock if the machine malfunctions.
EKG Augmented Limb Leads The same three leads that form the standard leads also form the three unipolar leads known as the augmented leads. These three leads are referred to as aVR (right arm), aVL (left arm) and aVF (left leg) and also record a change in electric potential in the frontal plane.
Augmented Leads • The Augmented Leads are formed by sending the non-selected arm or leg through the Central Terminal of Wilson ( 5,000 Ohm resistor). The Central Terminal of Wilson acts as the null point. This null point is obtained for each lead by adding the potential from the other two leads. For example, in lead aVR, the electric potential of the right arm is compared to a null point which is obtained by adding together the potential of lead aVL and lead aVF.
Precordial Leads • These six unipolar leads, each in a different position on the chest, record the electric potential changes in the heart in a cross sectional plane. Each lead records the electrical variations that occur directly under the electrode.
x To position chest leads – place V1 at in the 4th intercostal space at the right sternal border- place V2 at the 4th intercostals space at the left sternal border- place V4 next at the 5th intercostals space at the midclavicular line- now place V3 halfway between V2 and V4- place V5 in at the anterior axillary line in the 5th intercostals space- place V6 at the mid axillary line in the 5th intercostals space.
V3 V1 V2 V4 Intercostal spaces The electrode position provided is the standard placement. However, there are numerous variations of this placement depending on certain conditions. Figure 7.22a
The EKG Paper • Consider EKG paper as a graph with an X and Y axis. The X axis measures time in milliseconds. The Y axis measures voltage in millivolts. What is being measured are action potentials in the heart muscle cells and conduction system cells. Since, the electrodes are placed on the skin and not in a muscle cell or conduction system cell- a multitude of action potentials from thousands of cells is being monitored at the same time. • EKG paper has big boxes and small boxes. Each small box is 1 mm wide and tall. Each large box contains 25 small boxes. • Usually the EKG runs at a paper speed of 25 mm per second- if set at this speed each small box has a .04 second time duration. When the EKG is set at the standard setting for voltage- each small box is .1 mv.
EKG paper has big boxes and small boxes. Each small box is 1 mm wide and tall. Each large box contains 25 small boxes. Usually the EKG runs at a paper speed of 25 mm per second- if set at this speed each small box has a .04 second (large box 0.2 sec) time duration. When the EKG is set at the standard setting for voltage- each small box is .1 mv.
EKG Mounting • When a 12-lead EKG is taken – it is properly mounted in the usual manner below. I AVR V1 V4 II AVL V2 V5 III AVF V3 V6
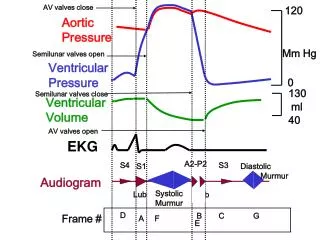
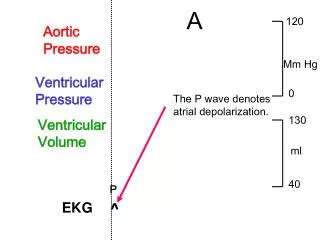
The mock tracing above delineates the standard EKG waves. These waves are recorded in a lead when action potentials move in various angulations to that particular lead. If action potentials are moving towards the positive pole of a lead the pin will defect upward- if moving away the pen will deflect downward. If no action potential actions are perceived in a said lead at a said time- the pen will stay on the baseline. If action potentials move a perfect perpendicular angle to a lead the pin will deflect as much up as it does down.
The standard EKG waves are the P, QRS and T waves. The P wave represents atrial depolarization, the QRS complex reflects ventricular depolarization and the T wave represents ventricular repolarization. No atrial depolarization is observed in that it occurs at the same time as ventricular depolarization- since this action is much larger charge event the atrial repolarization event is obscured by the ventricular action.
The P wave is caused by atrial depolarization. The P wave is usually smooth and positive. The P wave duration is normally less than 0.12 sec. • The PR interval is the distance from the start of the P wave till the start of the R wave. The PR interval represents the flow of action potentials from the SA node to the AV node. This time period should be .12 sec till .20 sec.
The PR segment is the portion on the EKG wave from the end of the P wave to the beginning of the QRS complex. The PR segment corresponds to the time between the end of atrial depolarization to the onset of ventricular depolarization. It is an isoelectric segment, during which the impulse travels from the AV node through the conducting tissue (bundle branches, and Purkinje fibers) towards the ventricles
The QRS complex represents the time it takes for depolarization of the ventricles. - due to ventricular depolarization. The normal QRS interval range is from 0.04 sec - 0.12 sec measured from the first deflection to the end of the QRS complex.
The ST segment represents the start of repolarization of the ventricles. The ST segment begins with the completion of the S wave and ends with the beginning of the T wave. This should be flat to the base line. If upward or downward deflections are observed- this could suggest certain pathology.
The T wave due to ventricular repolarization The wave is normally rounded and positive.
Interpretation of EKG Look at 1. Rate (normal resting heart rate 60 – 100 BPM 2. Rhythm – beats should occur with relative regularity 3. Axis – During one entire cardiac cycle – which direction do most of the action potentials travel 4. Waveform – are the waves normally timed and shaped
EKG Heart Rate Determination • Knowing the paper speed, it's easy to work out heart rate. It's also very convenient to have a quick way of eyeballing the rate, and one method is as follows: • Remember the sequence: 300, 150, 100, 75, 60, 50 • Identify an R wave that falls on the marker of a `big block' • Count the number of big blocks to the next R wave. • If the number of big blocks is 1, the rate is 300, if it's two, then the rate is 150, and so on. Rates in between these numbers are easy to `interpolate'.
R to R Count how many large boxes? 300, 150, 100, 75, 60, 50 This patient’s heart rate is a little greater than 60 BPM. The R waves are separated by a little less than 5 large boxes – thus not 300, not 150, not 100, not 75 but a littler greater than 60 BPM.
Heart Rhythm on EKG • On the mounted EKG – look at the very bottom tracing strip. Take a ruler and measure between one R wave to another one. See if the interval is the same. • There will be slight variations in the beat to beat timing and that is normal – particularly when inhaling and exhaling. • There is normally a slight degree of chaotic variation in heart rate, called sinus arrhythmia. Sinus arrhythmia is generally a good thing, and loss of this chaotic variation is of ominous prognostic significance.
R to R Distances – are they the same? This patient’s heart rate shows slight appropriate variation in rhythm.
Measuring distances of R waves to see if the beats are rhythmic
Cardiac Axis as viewed on EKG • The axis of the heart is what direction are the greatest action potentials traveling during one entire cardiac cycle. • Considering the left ventricle – should be the thickest cardiac chamber in the normal person – the main action potential direction should be down and towards the left of the patient. • A shift from this direction could correspond to heart pathology – i.e. hypertrophy of improper chambers. • It could also correspond to vertebral abnormalities like scoliosis.
How does one determine cardial axis? • Remembering the fact that if action potentials travel towards the positive end of a lead the EKG pen is deflected upwards. • Considering the fact – one wants to see the action potentials traveling down and to the left • A novelist EKG reader looks at leads I and AVF – paying attention to the R waves in these leads • To an expert EKG interpreter – one is looking for the “Greatest Net Vector Force”
The R wave is down in AVF in this drawing so it is abnormal. Quadrant I Quadrant II Quadrant III Quadrant IV If the R wave is up in Lead I and up in Lead AVF – the axis is in Quadrant IV that is the normal axis direction
R wave deflections Quadrant I Quadrant II Up in Lead I but down in AVF Down in Lead I and down In AVF Quadrant III Quadrant IV Up in AVF but down in Lead I Up in both Lead I and AVF
Evaluation of EKG Waveforms • The P wave is caused by atrial depolarization. The P wave is usually smooth and positive. The P wave duration is normally less than 0.12 sec. • A tall P wave (3 blocks or more) signifies right atrial enlargement, a widened bifid one, left atrial enlargement Right Atrial Enlargement Left Atrial Enlargement
The PR interval • The PR interval is the distance from the start of the P wave till the start of the R wave. The PR interval represents the flow of action potentials from the SA node to the AV node. This time period should be .12 sec till .20 sec. • It is widened in Heart Blocks – First degree, second degree or third degree
First degree block • This is manifest by a prolonged PR interval
Second degree block • Conduction intermittently fails completely. This may be in a constant ratio (more ominous, Type II second degree block), or progressive (The Wenckebach phenomenon, characterized by progressively increasing PR interval culminating in a dropped beat --- this is otherwise known as Mobitz Type I second degree heart block
Third degree block There is complete dissociation of atria and ventricles.
The QRS complex • The QRS complex represents the time it takes for depolarization of the ventricles. - due to ventricular depolarization. The normal QRS interval range is from 0.04 sec - 0.12 sec measured from the first deflection to the end of the QRS complex. • An initial downwards deflection is a Q (or q), any negative deflection after this is an S. An upward deflection is an R. Note that we refer to a second deflection in the same direction by adding a prime, so we have R', R'', S' and so on
Q wave versus Q point • A Q wave is greater than 1/3 the height of the next R a Q point is less than that height • A Q wave means the person has had a heart attack in the past • Many people who have had a prior MI will have an ECG that appears normal. There may however be typical features of previous MI, and the most conspicuous of these is Q waves. A simplistic explanation of these prominent Q waves is that an appropriately placed lead "sees through" the dead tissue, and visualizes the normal depolarization of the viable myocardial wall directly opposite the infarcted area
QRS Complex • Bundle Branch Blocks • Hemiblocks • Hypertrophy of ventricles