Download

1 / 48
600 likes | 919 Views
EKG Interpretation. Lecture #1. Current Flow & Lead Axis. Critical Learning Points : If the electrical current from the heart is moving toward an electrode placed on the chest, the EKG complex will be positive (upward deflection)

E N D
EKG Interpretation Lecture #1
Current Flow & Lead Axis • Critical Learning Points: • If the electrical current from the heart is moving towardan electrode placed on the chest, the EKG complex will be positive (upward deflection) • If the electrical current of the heart is moving awayfrom the electrode, the EKG complex will be negative (downward deflection) • The sum of all the electrical activities of the heart is consistent with the electrical activity of the left ventricle and is therefore directed downwardand to theleft of the body, approximately at 60°
EKG leads and their Axis • 12 leads of the EKG: • 6 in the vertical plane • I, II, III, aVR, aVF, & aVL • 6 in the horizontal plane • V1 – V6
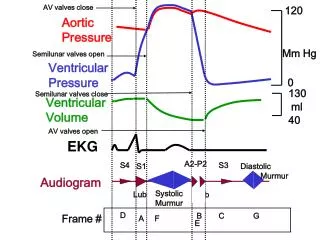
Cardiac Depolarization 1. SA NODE initiates Atrial Depolarization = P-wave 2AV NODE is depolarized; AV nodal delay = 0.10 sec 3. Depolarization is conducted via the Bundle of His 4. Depolarization is conducted further into the ventricles via the Left & RightBundle Branches 5. Septal Depolarization = Q-wave 6. “Early” Ventricular Depolarization (depolarization of the apex)= R-wave 7. “Late” Ventricular Depolarization (depolarization of the ventricular myocardium)= S-wave 8. Ventricular Repolarization = T-wave
Vertical Axis = Voltage • Vertical axis represents voltage on the EKG • One small box (1 mm) represents 0.10 mV • A tall vertical axis therefore can reflect increased voltage and/or hypertrophy • A short vertical axis reflects decreased voltage • example: obesity, COPD, cardiac tamponade
Horizontal Axis = Time • 1 small (1 mm) box = 0.04 seconds (40 ms) • 1 large (5 mm) box = 0.20 seconds (200 ms) • 5 large(5 mm) boxes = 1 second (1000 ms) • 15 large(5 mm) boxes = 3 seconds and is marked on EKG paper
Approach to EKG Interpretation • ALWAYS, ALWAYS, ALWAYS: 1. Rate 2. Rhythm(includes analysis of intervals) 3. Axis 4. Hypertrophy 5. Ischemia, Injury, or Infarct
Determining the Heart Rate • Count # of large boxes between 2 successive R-waves: • 1 box = 300 bpm • 2 boxes = 150 bpm • 3 boxes = 100 bpm • 4 boxes = 75 bpm • 5 boxes = 60 bpm • 6 boxes = 50 bpm • 7 boxes = 43 bpm • 8 boxes = 37 bpm l
Determining the rate forirregular rhythms • If the R-R Interval is irregular: • Count the number of QRS complexes in a 10 sec span (that is on the entire EKG) and multiplyit by 6! {or no. of QRS complexes in a 6 sec span multiplied by 10}
Determining the Cardiac Rhythm • First ALWAYS determine whether the rhythm is Sinusor Non-Sinus (SVT vs. VT)! • Determine the Intervals: a. P-wave duration b. PR interval c. QRS interval d. QT interval
Sinus Rhythm…or Not! 1. Every QRS is preceded by a P-wave 2. P-waves appear normal, that is they are ofsinus node origin: A. Normal Morphology: 1. P-wave duration < 0.12 sec (< 3 boxes) 2. P-wave height < 2.5 mm B. Normal Axis – upright P-waves in lead II
EKG Intervals • P-wave< 0.110 sec(approximately 3 small boxes) • PR interval = beginning of the P-wave to the beginning of QRS.Normal = 0.120 – 0.200 sec • QRSinterval=from the first deflection to return to the baseline.Normal< 0.120 sec 4. QT interval = beginning of the QRS to the END of the T-wave.Normal< 0.450 sec
Axis Basics • The axis measures the direction of the overall electrical activity of the heart • Hypertrophy of either ventricle can displace the axis: • Left Ventricular Hypertrophy (LVH) can result in Left Axis Deviation (LAD) • Right ventricular Hypertrophy (RVH) can result in Right Axis Deviation (RAD) • Similarly Bundle Branch Blocks can distort the axis
Approach to EKG Axis • The Limb Leads are used to determine the axis • Normal axis usually results in a + QRS complex (majority of the complex is above the baseline) in leads I, II, III & aVF • A normal axis falls between 0° & +90° • However, many authorities consider a normal axis between –30° & +105°
If lead I is positive, the green zone reveals the area of electrical activity Lead I -90 _ + I 0 aVF
aVF If aVF is positive, the red zone reveals the area of electrical activity – -90 + I 0 aVF
-90 I 0 If we superimpose these onto one another we find the axis to be between 0° & +90° aVF +90
LAD • May be caused by: HTN, aortic valvular disease & cardiomyopathies • Once you have determined that the axis lies between 0° & –90°, it is clinically useful to decided if it is between –30° & –90°, as this is true LAD
If lead I is positive then the blue zone is the area of electrical activity Lead I _ -90 + I 0 aVF +90
_ aVF If aVF is negative, the green zone is the area of electrical activity -90 + I 0 aVF +90
If we superimpose these onto one another we find the axis to be between 0° & –90° -90 I 0 aVF +90
True LAD • So again, if lead I is positive and aVF is negative, we suspect LAD • To diagnose true LAD, we examine lead II: • If lead II is positive, axis = 0° to –30° • If lead II is negative , axis =–30° to –90°
RAD • Right axis deviation is usually secondary to an enlarged right ventricle or pulmonary disease • Some of the ethiology include: pulmonary HTN, COPD or acute PE
If lead I is negative the green zone encompasses the area of electrical activity Lead I _ -90 + I 180 0 aVF +90
_ If aVF is positive, the red zone reveals the area of electrical activity aVF -90 + I 180 0 aVF +90
-90 I 180 0 If we superimpose these onto one another, we find the axis to be between 90° & 180° aVF +90
Extreme RAD • If lead I is negative AND aVF is alsonegative – extreme RAD • Clue: If aVR is positive = extreme RAD • This is seen with rare situations such as VT or Pacemakers • In general we should never have an axis over here!
EKG Axis Summary • look at lead I and aVF: • if both are positive = Normal axis • If Iis positive but aVF is negative = probable LAD • If between 0° & –30° = upper limits of normal • If between –30°& –90° =True LAD(check lead II to determine) • If Iis negative = RAD (axis > 90°)…you can be more specific and decide: • If between +90 & +120= upper limits of normal • If between +120 to +180=True RAD • When both I & aVF are negative, axis is between -90 and +/-180 – this isExtreme RAD
Finally: EKG Axis for Dummies! • Lead I =left thumband aVF =right thumb • If bothI& aVFareup = Normal Axis • IfIisupbutaVFisdown = LAD • IfIisdownbutaVFisup = RAD • If bothI&aVFare down = Extreme RAD