Download
1 / 9
380 likes | 1.13k Views
( Acquaah 2012). Ch 5. Genotype x environment interaction. 1. Relationship between genotype and environment ( 1) Environments : All of the external factors affecting crop performance Biological (biotic) E. : disease and insect pests, weeds, . . .

E N D
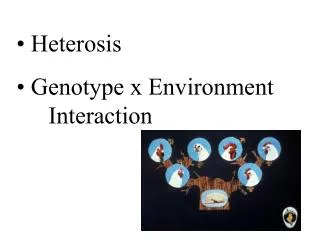
(Acquaah 2012) Ch 5. Genotype x environment interaction 1. Relationship between genotype and environment (1) Environments : All of the external factors affecting crop performance Biological (biotic) E. : disease and insect pests, weeds, . . . Physical/Chemical (abiotic) E. : temperature, soil, sun light, rainfall. . . . Predictable factors : soil type, planting date, (row) spacing, nutrient application, . . . Unpredictable factors : rainfall, temperature, relative humidity, light intensity & duration, CO2 circumstances, . . .
(2) Type of GxE interaction (GEI) Demonstration of GxE interaction (b) Different response, genotype ranking – maintained (c) (d) Reversal of response, genotype ranking – changed
2. Measurement of G x E interaction (GEI) Generalized linear model (GLM) (Phenotype) X = Mean of whole plots Genotypic effect Environmental effect G x E interaction effect = If large wide -adaptable variety locational difference of varietal performance If large variety adaptable to specific environment yearly difference of varietal performance ANOVA L & Y difference of varietal performance
Analysis of GEI – other approaches • Rank sum index (nonparametric approach) • Cluster analysis • Factor analysis • Principal component analysis • AMMI • Pattern analysis • Analysis of crossovers • Partial Least Squares Regression • Factorial Regression
3. Stability analysis • ○ Static stability: performance of a genotype does not change under different environmental conditions (relevant for disease resistance, quality factors) • ; Homeostatic stability (Biological S.) (Finlay & Wilkinson 1963 등) • ○ Dynamic s. : genotype performance is affected by the environment, but its relative performance is consistent across environments. It responds to environmental factors in a predictable way. ; Agronomic stability (Everhart & Russsel 1966) dynamic s. morepractical (agronomically stable) Ideal static s. : rare wide-adaptible variety Yield static s. Specific or narrow adaptation Unfavor- able favorable environment
Measures of stability a. CV and mean of individual genotypes across locations : Francis & Kannenberg(1978) Can. J.Plant Sci. 58: 1029-1034 b. Regression of genotypes on environmental index • Everhart & Russel 1966. Stability parameters from comparing varieties. Crop Sci. 6: 36-40 c. Ecovalence • Wricke, 1962 d. Superiority measure of cultivars • Lin and Binns, 1988 e. Many others… a.
Additive Main Effects and Multiplicative Interaction (AMMI) Analysis SHAFII and PRICE (1998) J. Agric. Biol., and Environ. Statistics 3: 335-345, • Traditional statistical analyses (GLM) of yield trials provide little or no insight into the particular pattern or structure of the GE interaction. • AMMI Model incorporates both additive and multiplicative components of the two-way data structure which can account more effectively for the underlying inter- action patterns • Integrating results obtained from biplot graphic displays with those of the genotypic stability analysis enables • clustering of genotypes based on similarity of response and • the degree of stability in performance across diverse environments. MATMODEL Version 3.0 (Gauch 2007)
Case study) Measurement of GEI and stability using AMMI analysis African rice 22 vars; 6 environments (3 locations, 2 years) Grain yield ;MATMODEL Ver 2.2 Sanni et al(2010) Asian J Plant Sci 8: 48-53
Biploit of grain yield of 22 rice genotypes and environments AMMI plot for rice grain yield Biploit of the IPCA1 and IPCA2 scores for grain yield Positive interaction& high yield Stable& high yield relatively stable negative interaction& high yield