Download
1 / 17
170 likes | 419 Views
ECOLOGICAL IMPACT SUMMARY PROJECT. Richard S. Halbrook Cooperative Wildlife Research Laboratory Southern Illinois University Howard Whiteman Department of Biological Sciences Murray State University. Objective.

E N D
ECOLOGICAL IMPACT SUMMARY PROJECT Richard S. Halbrook Cooperative Wildlife Research Laboratory Southern Illinois University Howard Whiteman Department of Biological Sciences Murray State University
Objective • This project will collect, evaluate, and summarize ecological assessments and management activities • Provide an ecological strategy to guide future ecological activities • Produce a “living” document that will serve as the basic reference for ecological assessments and management-related activities
Phase I Collect and chronologically organize existing ecological data Identify contaminants of concern Develop potential food web contaminant transfer models for terrestrial and aquatic environments
Phase II Perform a detailed evaluation and summation of existing ecological assessments and management-related activities Merge existing data from historical studies with potential food web conceptual models to identify existing data gaps
Phase III Develop a strategy that provides an extensive summary of the chronology and results of historical ecological assessments Provide a framework for future ecological study that addresses identified data gaps and information needed for future management decisions.
Objective 1: Collect and Chronological Organization of Data • Existing data, estimated to be greater than 800 individual documents, have been located and are being entered into EndNotes Bibliographic Management System. • currently several hundred documents have been entered into the database. This is and will continue to be an ongoing process.
Objective 2: Identification of Contaminants of Ecological Concern • A summary of metal, polychlorinated biphenyl (PCB), and radionuclide data reported in various reports and documents relating to analysis of biological samples has been compiled.
Kidney and liver Cd concentrations > 10 mg/kg FW = Cd contamination Kidney Cd concentrations > 100 mg/kg FW = life threatening Paducah deer max kidney Cd = 3.88 mg/kg Liver Pb concentrations > 20 mg/kg FW = concern Paducah deer max liver Pb = 3.3 mg/kg Paducah river otter max liver concentration = 4.85 mg/kg FW Tissue Hg concentrations > 4.0 mg/kg FW = concern Liver Hg concentrations >10 mg/kg FW = sublethal effects Paducah river otter liver Hg concentrations = 1.38 mg/kg FW Liver total PCB concentrations > 4 mg/kg FW = concern Paducah mink liver concentration = 1.1 mg/kg Aroclor 1260 (n = 1) Paducah river otter liver concentration = 2.47 & 4.75 mg/kg Aroclor 1260
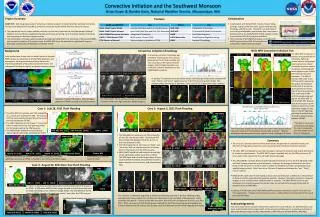
Objective 3: Develop Conceptual Food Web Transfer Models • A generalized conceptual food web model (contaminants transfer model) for the PGDP and surrounding area was developed along with more specific aquatic, avian, and mammalian trophic position models.
Paducah Food Web Model (contaminants transfer model) bobcat hawks owl coyote otter Raccoon fox heron skunk mink bats reptiles shrew opossum woodcock turkey fish deer starling swallow duck mice bobwhite rabbit squirrel amphibians muskrat aquatic inverts beaver insects vegetation sediment runoff Soil invertebrates Soil
Aquatic Food Web (contaminant transfer model) heron otter mink Trophic position 4 predatory fish snakes swallow turtles Trophic position 3 frogs duck sun fish muskrat Trophic position 2 tadpoles invertebrates (aquatic) beaver crayfish zooplankton vegetation Trophic position 1 benthic organisms Phytoplankton (algae) detritus sediment
Terrestrial Mammalian Food Web (contaminant transfer model) otter mink Trophic position 4 bobcat coyote fox raccoon Trophic position 3 bats skunk shrew turkey opossum Trophic position 2 bobwhite deer mice rabbit squirrel muskrat insects Trophic position 1 vegetation Soil invertebrates Soil
Terrestrial Avian Food Web (contaminant transfer model) heron Trophic position 4 hawks owl Trophic position 3 snakes starling turkey Trophic position 2 frogs bobwhite mice rabbit insects Soil invertebrates Trophic position 1 vegetation Soil