Download
1 / 1
10 likes | 156 Views
GIS, Building Simulation, and Microbes in Flood Impact Studies. Jonathon Taylor 1,2 , Ka Man Lai 1 , Michael Davies 2. 1 Department of Civil, Environmental, and Geomatic Engineering, UCL 2 The Bartlett School of Graduate Studies, UCL. Data Analysis

E N D
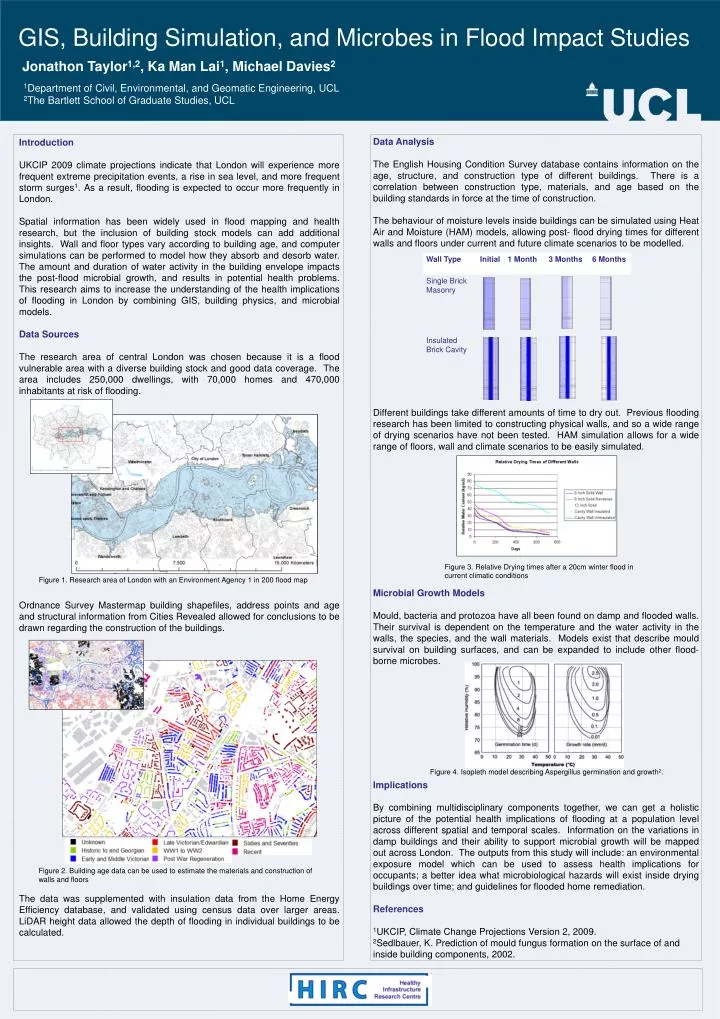
GIS, Building Simulation, and Microbes in Flood Impact Studies Jonathon Taylor1,2, Ka Man Lai1, Michael Davies2 1Department of Civil, Environmental, and Geomatic Engineering, UCL 2The Bartlett School of Graduate Studies, UCL Data Analysis The English Housing Condition Survey database contains information on the age, structure, and construction type of different buildings. There is a correlation between construction type, materials, and age based on the building standards in force at the time of construction. The behaviour of moisture levels inside buildings can be simulated using Heat Air and Moisture (HAM) models, allowing post- flood drying times for different walls and floors under current and future climate scenarios to be modelled. Different buildings take different amounts of time to dry out. Previous flooding research has been limited to constructing physical walls, and so a wide range of drying scenarios have not been tested. HAM simulation allows for a wide range of floors, wall and climate scenarios to be easily simulated. Microbial Growth Models Mould, bacteria and protozoa have all been found on damp and flooded walls. Their survival is dependent on the temperature and the water activity in the walls, the species, and the wall materials. Models exist that describe mould survival on building surfaces, and can be expanded to include other flood-borne microbes. Implications By combining multidisciplinary components together, we can get a holistic picture of the potential health implications of flooding at a population level across different spatial and temporal scales. Information on the variations in damp buildings and their ability to support microbial growth will be mapped out across London. The outputs from this study will include: an environmental exposure model which can be used to assess health implications for occupants; a better idea what microbiological hazards will exist inside drying buildings over time; and guidelines for flooded home remediation. References 1UKCIP, Climate Change Projections Version 2, 2009. 2Sedlbauer, K. Prediction of mould fungus formation on the surface of and inside building components, 2002. Introduction UKCIP 2009 climate projections indicate that London will experience more frequent extreme precipitation events, a rise in sea level, and more frequent storm surges1. As a result, flooding is expected to occur more frequently in London. Spatial information has been widely used in flood mapping and health research, but the inclusion of building stock models can add additional insights. Wall and floor types vary according to building age, and computer simulations can be performed to model how they absorb and desorb water. The amount and duration of water activity in the building envelope impacts the post-flood microbial growth, and results in potential health problems. This research aims to increase the understanding of the health implications of flooding in London by combining GIS, building physics, and microbial models. Data Sources The research area of central London was chosen because it is a flood vulnerable area with a diverse building stock and good data coverage. The area includes 250,000 dwellings, with 70,000 homes and 470,000 inhabitants at risk of flooding. Ordnance Survey Mastermap building shapefiles, address points and age and structural information from Cities Revealed allowed for conclusions to be drawn regarding the construction of the buildings. The data was supplemented with insulation data from the Home Energy Efficiency database, and validated using census data over larger areas. LiDAR height data allowed the depth of flooding in individual buildings to be calculated. Figure 3. Relative Drying times after a 20cm winter flood in current climatic conditions Figure 1. Research area of London with an Environment Agency 1 in 200 flood map Figure 4. Isopleth model describing Aspergillus germination and growth2. Figure 2. Building age data can be used to estimate the materials and construction of walls and floors