Download
1 / 7
70 likes | 211 Views
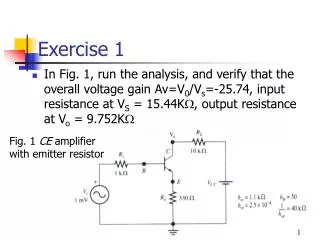
DQO Training Course Day 2. Exercise 1. Populations, Histograms, Range & Simulations. Presenter: Sebastian Tindall. (45 minutes) (75 minute Lunch Break). Exercise 1. Overview of Activities Begin construction of DPGD Record population values Construct sample histogram:

E N D
DQO Training Course Day 2 Exercise 1 Populations, Histograms, Range & Simulations Presenter: Sebastian Tindall (45 minutes) (75 minute Lunch Break)
Exercise 1 Overview of Activities • Begin construction of DPGD • Record population values • Construct sample histogram: • Take a random sample • Construct and compare sample histograms (FDH) and ranges to population • Combine data so that n = 50 and construct a new class histogram and find new class range
Exercise 1 • The bag of beads represent the entire population. • Each bead represents the concentration of one location within a site (one member of the population). • Five samples (beads) will be collected, randomly. • Students will generate histograms for the 5 beads.
Exercise 1 Begin construction of DPGD • Remove the FDH and DPGD graphs from the binder. • Set the FDH graphs aside. • Label the DPGD with: • AL = 7 (Red ink) • LBGR = 6 (Blue ink) • Gray Region (Blue ink) • Set DPGD aside until Exercise 3
Exercise 1 Record population values: • Population N = • Sample n = • Can we assume sampling without replacement methods apply? • In other words, is n less than 5% of N? _____(Note: 5/450 x 100% = 1.1%.) • True range, i.e., Max - Min = = 450 5 Yes 14 - 0 14
Exercise 1 (contd.) Construct sample histogram • Take one FDH graph. • Randomly select 5 beads and record values on the FDH graph. • Students will plot the range of the five samples. • The class will combine the data from their five samples to obtain a fifty sample result. • The computer will plot the histogram and range of the fifty samples. • The computer will simulate the 5 and 50 sample events, histograms, and ranges. • Students will discuss whether 5 or 50 samples are adequate to characterize the site.
End of Exercise 1 Thank you Questions? We will now take a 75 minute lunch break. Please be back at 1:00 PM.