Download

1 / 47
490 likes | 699 Views
Computational Proteomics. Dong Xu Computer Science Department 109 Engineering Building West E-mail: xudong@missouri.edu http://digbio.missouri.edu 573-882-7064 (O). Outline. Introduction Protein identification using Mass-spec Protein interaction and pathway Summary.

E N D
Computational Proteomics Dong Xu Computer Science Department 109 Engineering Building West E-mail: xudong@missouri.edu http://digbio.missouri.edu 573-882-7064 (O)
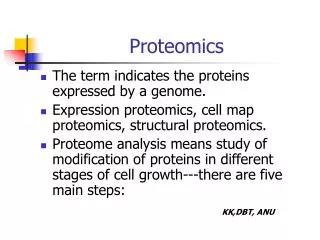
Outline • Introduction • Protein identification using Mass-spec • Protein interaction and pathway • Summary
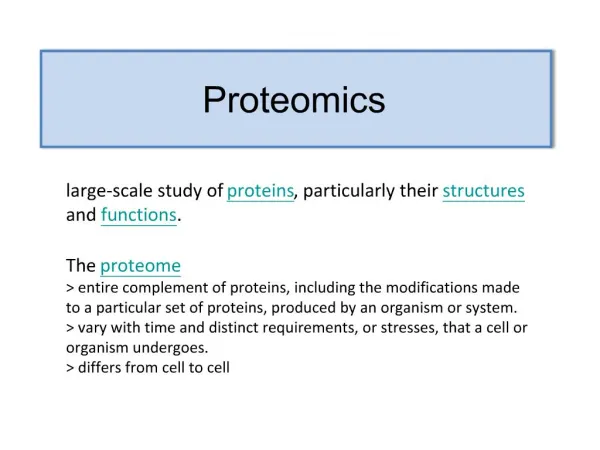
Introduction – What is Proteomics? “The identification, characterization and quantification of all proteins involved in a particular pathway, organelle, cell, tissue, organ or organism that can be studied in concert to provide accurate and comprehensive data about that system.” http://www.inproteomics.com/prodef.html
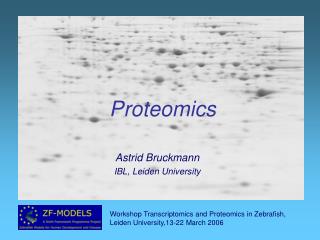
Scope of proteomics Graves and Haystead (2002) Microbiol & Molec. Biol. Rev. 66, 39-63
Outline • Introduction • Protein identification using Mass-spec • Protein interaction and pathway • Summary
Eucaryote Gene/Protein Expression Control nucleus cytosol inactive mRNA mRNA degradation control Primary RNA transcript DNA mRNA mRNA RNA transport control translation control transcriptional control RNA processing control protein protein degradation control Methods: Masspect Microarray post translational control nucleus membrane inactive protein modified protein
2D Page Control Toxicant experimental mass isoelectric point Bruno ME et al., Arch Biochem Biophys (2002) 406,153-164
Mass Spectroscopy Techniques • Matrix assisted laser de-adsorption time-of-flight (MALDI-TOF) • mainly for peptide mass mapping • Electro-spray MS-MS • more sensitive for protein identification • de novo amino acid sequence.
MS fingerprint for protein protein MPSESSYKVHRPAKSGGS trypsin digestion peptides MPSESSYK VHR PAK SGGS
In-silico Digestion MPSESSYKVHRPAKSGGS another protein …… in-silico digestion in-silico digestion …… ……
Peak Picking • |PM(a) – PM(b)| < Error • score(TM(a), TM(bi))
MOWSE Score (1) • Popular scoring scheme used. • Protein score based on frequency of occurrence of peptides. • Frequency table is created for every database used.
MOWSE Score (3) • Bin frequencies are normalized by dividing by maximum number in the column. • Scoring scheme Sj = 50 / (Pn * H) where Pn is the product of n normalized frequencies of matching peptides, H is the protein molecular weight. • Proteins are ranked by their scores.
Too many matches • For each mass, there are very many peptides in the database with the mass. • There are many missed peaks in the MS. • There are many noise in the MS. • For each MS, there could be many proteins in the database that matches the MS.
Computational Studies on Confidence Assessment for Protein Identification We have developed a statistical model which give a p-value indicating the confidence for the protein identification to be true. The model is based on the Extreme Value Distribution of the protein identification scores from a randomly shuffled MS spectral peaks. Score: 1268 P-value: 0.025 Distribution of score for Swissprot with a large number of input spectra Cumulative Distribution of score
Tandem Mass (MS/MS) Spectrum MRIMVRTLRGDRVALDVDGATTTVAQVKGMVMARER MRIMVRTLRGDRVALDVD GATTTVAQVKGMVMARER b-ion y-ion Assumption: Will break between every two amino acids, providing a unique sequence pattern.
A real MS/MS spectrum with good quality LGSSEVEQVQLVVDGVK
MKFLILLFNILCLFPVLAADNHGVGPQGAS... Sp = S(im) * nm * (1+b) * (1+r) / nt SEQUEST: Preliminary Score While parsing through the database, all peptides that match the input mass within some user specified mass tolerance (i.e. +/- 1.0 amu) get a preliminary score (Sp): S (im) = sum of matched intensities nm = number of matched fragment ions nt = number of total fragment ions b = fragment ion continuity factor r = immonium ion factor
X-Correlation Score • Sequence database has been parsed. • Candidate peptides for correlation analysis are the top 500 preliminary scoring peptides. • A theoretical spectrum is constructed for each candidate peptide and compared against the input spectrum via correlation analysis. Discrete correlation function: R[t] = Sx[t]y[t+t] Calculated via Fourier Transforms: R[t] <=> X(f)Y*(f) t
Calculation of X-Correlation Score 88.1 185.2 361.5 490.6 561.7 692.9 806.0 893.1 1050.2 1226.4 Theoretical spectrum m/z 200 400 600 800 1000 1200 x8 100 1007.4 80 Experimental spectrum 1155.5 60 662.3 1226.8 892.6 805.5 255.7 40 360.9 403.0 519.1 20 185.3 1324.8 250 500 750 1000 1250 m/z
De Novo Sequencing Using Spectrum Graph Approach • Each node of the graph represents a peak in the spectrum. • Two nodes have an edge if and only if the two corresponding peaks are distanced with the mass of an amino acid. • The path that connects the two ends corresponds to a feasible solution.
Outline • Introduction • Protein identification using Mass-spec • Protein interaction and pathway • Summary
Protein Complex Nucleosome
Protein-Protein Interactions • Protein complexes, molecular machines • Protein interaction cascade (signal transduction) • Transient vs. stableinteraction • Binary interaction vs. complex m k h e d preys a bait f b
Genetic vs. Physical Interaction Signal transduction Complex system Physical interaction Regulatory network Genetic interaction Transcription factor Expressed gene
Experimental methods • Yeast Two-hybrid screens • Mass Spectrometry • Immunoprecipitation • Affinity binding • Antibody blockage • Protein chips
Rosetta stone approach forpredicting protein interaction • protein A is homologous to subsequence from protein C • protein B is homologous to subsequence from protein C • subsequences from A and B are NOT homologous to each other
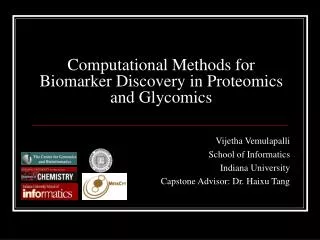
Yeast Protein Interaction Network An example of a scale-free network • Most nodes have few connections • A small number of nodes (network hubs) are connected to a large number of other nodes Deletion phenotype: Red = lethal Green = non-lethal Orange = slow growth Yellow = unknown
PPI Viewer • Protein-Protein-Interaction and Complex Viewer • http://mips.gsf.de/proj/yeast/CYGD/interaction/ • Search ste20 (YHL007c, STE20, Ste20p, ste20D) Complex data (Bate: Rad1p) Rad1p, Car2p, Dun1p, Far1p, Gpd1p, Gpd2p, Msi1p, Pdc6p, Sec6p, Sen1p, Ste20p, Ubi4p, YDR324c, YGR086c, YHR033w, YLR368w, YNL116w, YPL004c Binary interaction: cdc28 >genetic< ste20 Bem1p >physical< Ste20p Ste20p >physical< Prp20p ...
Protein Interaction Graph http://portal.curagen.com/extpc/com.curagen.portal.servlet.Yeast
Predict cellular functionfor hypothetical protein • Function inference based on neighbors • Consensus approach • Markov random field
Overview of Signal Transduction Stimuli (signal) CELL Secretion Motility Metabolism Genetic Transfer Cell-Cell Communication Sporulation/ Apoptosis Gene Transcription Essential for understanding disease and designing drug
sensor Protein-1 Protein-2 Protein-3 Problem Formulation signal • Define cascade proteins • Find interaction path Gene-1 Gene-2 transcription factor Nucleus Cascade of (physical) protein interaction chains
Finding a plausible signal cascade path • Short path • Biologically meaningful (function, subcellular location)
Ssy1p Ptr3p Ssy5p poor nitrogen GAP1… (general) rich amino acid BAP2… (specific) Ubc4p Ptr1p Ubc2p Cup9 Ptr2p PTR2 peptide transport Pathway Construction forAmino Acid Transport in Yeast
Ptr2p Cup9p Bap2p Tat2p Ssy1p Ptr3p Ssy5p Gcn4p Amino acid synthesis Aut10p Tup1p YPL158C Cln1p Rpn6p Mai1p Ssn6p Cdc28p Jsn1p Pre1p Dipeptide Clb3p Vma22p Cns1p Ubc4p Rtg3p Mig1p Sho1p Ubc2p Ptr1p Energy metabolism Glucose metabolism Gln3p Dal80p Stp1p X Two hybrid Gap1p Complex from Mass Coprecipitate or pull-down Other biochemical methods Transcriptional control Working Model
Scope of proteomics Graves and Haystead (2002) Microbiol & Molec. Biol. Rev. 66, 39-63
Reading Assignments • Suggested reading: • http://www.astbury.leeds.ac.uk/Facil/MStut/mstutorial.htm • Yu Chen and Dong Xu. Computational Analyses of High-Throughput Protein-Protein Interaction Data. Current Protein and Peptide Science. 4:159-181. 2003. • Optional reading: www.bio.davidson.edu/courses/genomics/proteomics.html
Optional Assignment (1) • Make a yeast protein-interaction network connecting Rho2p, Rom2p, Ste20p, and Pfy1p. Use binary physical protein-protein interaction to connect all the edges. Try to make the network as simple as possible (i.e., involving few proteins). • Can you predict the function of the yeast gene YLR269C based on high-throughput protein-protein interaction data? How confident are you on this prediction?
Optional Assignment (2) • A protein complex was identified containing Rpn5p, Rri1p, YDR179Cp, YIL071Cp, YMR025Wp, YOL117Wp. Can you find the bait of this complex? How many possible binary interactions in this complex can be verified by yeast two-hybrid data? • It is known that Cup9p is degredated by 26S proteasome. Identify as many proteins in the yeast 26S proteasome as possible. Find a physical interaction network between proteins in 26S proteasome and Cup9p.