Download
1 / 17
180 likes | 266 Views
The ChesROMS Community Model. Raleigh Hood, Wen Long, Jiangtao Xu, Jerry Wiggert, Lyon Lanerolle, and Christopher Brown. Funded by the NOAA Ecological Forecasting and MERHAB programs. Motivation:.

E N D
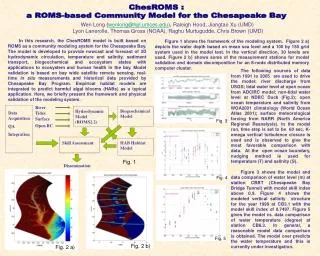
The ChesROMS Community Model Raleigh Hood, Wen Long, Jiangtao Xu, Jerry Wiggert, Lyon Lanerolle, and Christopher Brown Funded by the NOAA Ecological Forecasting and MERHAB programs
Motivation: • Provide T, S and biogeochemical forcing for empirical Sea Nettle, HAB and pathogen nowcasts and short-term forecasts that we are generating as part of our NOAA funded projects. • Provide nowcasts and short-term forecasts of 3D hydrodynamic circulation, temperature and salinity, sediment transport, and biogeochemical properties for research, management and public uses in Chesapeake Bay.
ChesROMS Grid and Implementation (chief architects, Dr. Jiangtao Xu and Dr. Wen Long) • Chesapeake Bay implementation of ROMS • Curvilinear horizontal grid • Horizontal Grid (100 * 150) • Includes all major tributaries • Diffuse freshwater inputs estimated • C and D canal: treated as a river • Hindcast and operational implementations
ChesROMS Grid and Implementation • Sigma-coordinate vertically • 20 levels • Increased resolution at surface and bottom boundaries • Turbulence closure: κ-ω
ChesROMS Forcing • Tides --- ADCIRC 9 harmonics • River discharge – USGS daily mean data • Surface Wind and Heat Flux (NAM/NARR) • Open BC non-tidal water level (NWLON) • Open BC T and S (WOA2001) • All forcing data compiled for 1991-2005 • (14 yr time-series) • Operational forcing for nowcast and 3-day forecast ADCIRC: Advanced Circulation Model NAM: North American Mesoscale Model NARR: North American Regional Reanalysis NWLON: National Water Level Observation Network WOA: World Ocean Atlas
NAM/NARR Wind and Surface Fluxes • Surface wind, air pressure, heat flux and long wave radiation • Surface temperature is NOT relaxed to observations
Effects of OBC Temp. and Salinity • Do not have results yet for WOA01 vs. WOA05 but have compared WOA01 to GODAS during model development • GODAS OBC TS gives less stratified system in lower bay compared to data • WOA OBC TS gives stratification of lower bay closer to measured data
Effects of C & D Canal flux • Inflow brings low salinity water into upper bay • Important to incorporate C & D canal in model for upper bay physical structure and dynamics • Gives better upper bay salinity structure prediction
Effects of Turbulence Closures Compared the four closures: 1. Mellor-Yamada 2.5 2. KPP 3. Generic Length Scale (GLS) Mellor-Yamada 4. Generic Length Scale (GLS) K-omega • Results: • Mellor Yamada (MY) 2.5 similar to KPP • GLS K-omega similar to GLS MY 2.5 • GLS K-omega gives best comparison to data in terms of vertical mixing/stratification
ChesROMS Available through SourceForge http://sourceforge.net/projects/chesroms/
Retrospective Run (1991 - 2005)(chief architect, Dr. Jiangtao Xu) • 15 year retrospective validation run • Large variations in freshwater discharge • Lets focus on 2003 as • an example
Temperature and salinity (2003) • CB5.3 • Mid Bay • Temperature simulation excellent • Salinity simulation not as good
2003 Model Skill for Temperature • Correlations on the order of 0.99 • Normalized standard deviation close to 1
2003 Model Skill for Salinity • Correlations on the order of 0.75-0.85 • Normalized standard deviation generally > 1 • The model tends to underestimate the salinity variabiliy in most regions, though there are some exceptions, like in some of the flank (shallow stations)
Why the Reduced Skill for Salinity? • At least partially due to smoothed topography • It has also been suggested that ROMS tends underestimate stratification (is this true?) • The fact that the model tends to underestimate the standard deviation is consistent with over mixing
ChesROMS Biogeochemical Model - Work in Progress (chief architect Dr. Jerry Wiggert) • Based on Fennel et al. core model bundled with ROMS • NPZD type model with oxic sediment denitrification • Adding DON • ISS loading • Atmospheric N deposition • Anoxic benthic denitrification • Water column denitrification,