Download
1 / 1
10 likes | 102 Views
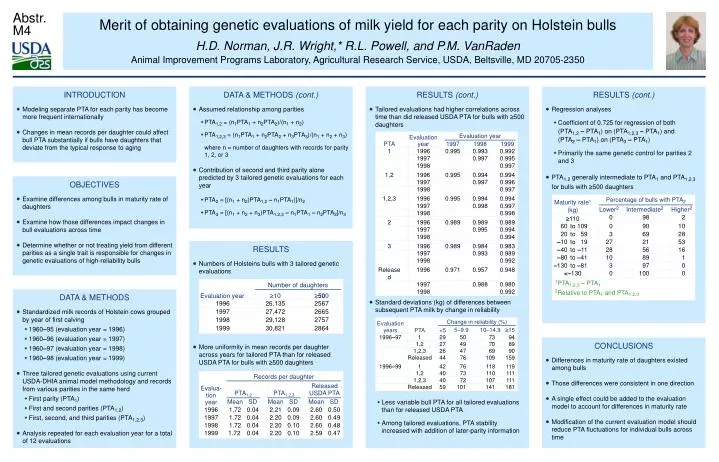
Abstr. M4. Merit of obtaining genetic evaluations of milk yield for each parity on Holstein bulls H.D. Norman, J.R. Wright,* R.L. Powell, and P.M. VanRaden Animal Improvement Programs Laboratory, Agricultural Research Service, USDA, Beltsville, MD 20705-2350. INTRODUCTION

E N D
Abstr. M4 Merit of obtaining genetic evaluations of milk yield for each parity on Holstein bulls H.D. Norman, J.R. Wright,* R.L. Powell, and P.M. VanRaden Animal Improvement Programs Laboratory, Agricultural Research Service, USDA, Beltsville, MD 20705-2350 INTRODUCTION • Modeling separate PTA for each parity has become more frequent internationally • Changes in mean records per daughter could affect bull PTA substantially if bulls have daughters that deviate from the typical response to aging DATA & METHODS (cont.) • Assumed relationship among parities • PTA1,2 = (n1PTA1 + n2PTA2)/(n1 + n2) • PTA1,2,3 = (n1PTA1 + n2PTA2 + n3PTA3)/(n1 + n2 + n3) where n = number of daughters with records for parity 1, 2, or 3 • Contribution of second and third parity alone predicted by 3 tailored genetic evaluations for each year • PTA2 = [(n1 + n2)PTA1,2– n1PTA1)]/n2 • PTA3 = [(n1 + n2 + n3)PTA1,2,3– n1PTA1– n2PTA2]/n3 RESULTS (cont.) • Tailored evaluations had higher correlations across time than did released USDA PTA for bulls with 500 daughters • Standard deviations (kg) of differences between subsequent PTA milk by change in reliability • Less variable bull PTA for all tailored evaluations than for released USDA PTA • Among tailored evaluations, PTA stability increased with addition of later-parity information RESULTS (cont.) • Regression analyses • Coefficient of 0.725 for regression of both (PTA1,2– PTA1) on (PTA1,2,3– PTA1) and (PTA2– PTA1) on (PTA3– PTA1) • Primarily the same genetic control for parities 2 and 3 • PTA1,2 generally intermediate to PTA1 and PTA1,2,3 for bulls with 500 daughters OBJECTIVES • Examine differences among bulls in maturity rate of daughters • Examine how those differences impact changes in bull evaluations across time • Determine whether or not treating yield from different parities as a single trait is responsible for changes in genetic evaluations of high-reliability bulls RESULTS • Numbers of Holsteins bulls with 3 tailored genetic evaluations • More uniformity in mean records per daughter across years for tailored PTA than for released USDA PTA for bulls with 500 daughters DATA & METHODS • Standardized milk records of Holstein cows grouped by year of first calving • 1960–95 (evaluation year = 1996) • 1960–96 (evaluation year = 1997) • 1960–97 (evaluation year = 1998) • 1960–98 (evaluation year = 1999) • Three tailored genetic evaluations using current USDA-DHIA animal model methodology and records from various parities in the same herd • First parity (PTA1) • First and second parities (PTA1,2) • First, second, and third parities (PTA1,2,3) • Analysis repeated for each evaluation year for a total of 12 evaluations CONCLUSIONS • Differences in maturity rate of daughters existed among bulls • Those differences were consistent in one direction • A single effect could be added to the evaluation model to account for differences in maturity rate • Modification of the current evaluation model should reduce PTA fluctuations for individual bulls across time