Download
1 / 41
420 likes | 533 Views
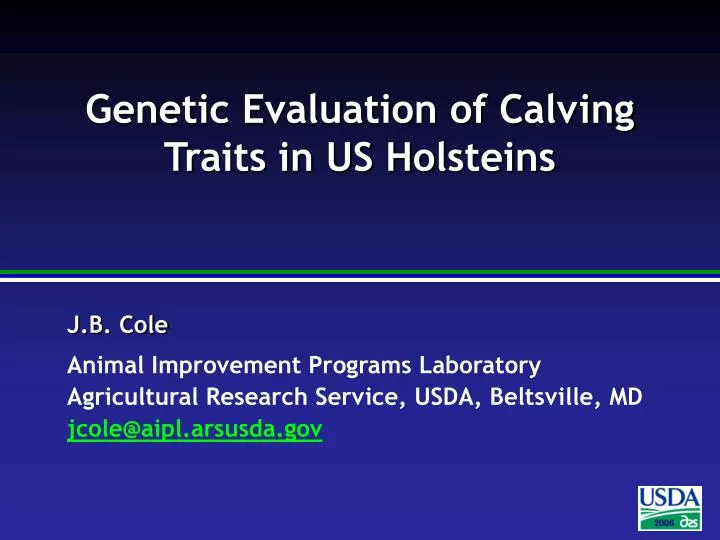
Genetic Evaluation of Calving Traits in US Holsteins. Introduction. A national evaluation was implemented for calving ease ( CE ) in August 2002 and for stillbirth ( SB ) for Holstein in August 2006. A calving ability index ( CA$ ) which includes SB and calving ease ( CE ) was developed.

E N D
Introduction • A national evaluation was implemented for calving ease (CE) in August 2002 and for stillbirth (SB) for Holstein in August 2006. • A calving ability index (CA$) which includes SB and calving ease (CE) was developed. • Some challenges with the CE and SB evaluations remain
Calving Ease Definition • Reported on a five-point scale: 1 = No problem 2 = Slight problem 3 = Needed assistance 4 = Considerable force 5 = Extreme difficulty • Scores of 4 and 5 are combined
Stillbirth Definition • Reported on a three-point scale: • Scores of 2 and 3 are combined
0 1 2 3 Total 1 1,287,290 4,343,140 158,250 20,418 5,809,098 2 203,738 482,720 49,858 2,537 738,853 3 183,951 375,203 70,522 3,353 633,029 4 59,614 108,037 37,851 1,740 207,242 5 23,690 38,929 32,196 1,272 96,087 Total 1,758,283 5,348,029 348,677 29,320 7,484,309 Distribution of Stillbirth and Calving Ease Scores Stillbirth Score Calving Ease Score
Data and Edits • 7 million SB records were available for Holstein cows calving since 1980 • Herds needed ≥10 calving records with SB scores of 2 or 3 for inclusion • Herd-years were required to include ≥20 records • Only single births were used (no twins)
Sire-MGS Threshold Model • Implemented for calving ease (Aug 2002) and stillbirth (Aug 2006) • Sire effects allow for corrective matings in heifers to avoid large calves • MGS effects control against selection for small animals which would have difficulty calving
Genetic Evaluation Model • A sire-maternal grandsire (MGS) threshold model was used: • Fixed: year-season, parity-sex, sire and MGS birth year • Random: herd-year, sire, MGS • (Co)variance components were estimated by Gibbs sampling • Heritabilities are 3.0% (direct) and 6.5% (MGS)
Trait Definition • PTA are expressed as the expected percentage of stillbirths • Direct SB measures the effect of the calf itself • Maternal SB measures the effect of a particular cow (daughter) • A base of 8% was used for both traits: • Direct: bulls born 1996–2000 • Maternal: bulls born 1991–1995
Dystocia and Stillbirth • Meyer et al. (2001) make a strong argument for the inclusion of dystocia in models for SB • Difficulty of interpretation - formidable educational challenge • Interbull trait harmonization - none of the March 2006 test run participants included dystocia in their models • Changes in sire and MGS solutions on the underlying scale between models were small
Evaluation Conclusions • Reliabilities for SB averaged 45% versus 60% for CE • Phenotypic and genetic trends from 1980 to 2005 were both small • An industry-wide effort is underway to improve recording of calf livability
Index Data • 7 million SB records were available for Holstein cows calving since 1980 • Calvings with unknown MGS were eliminated for VCE • Records with sire and MGS among the 2,600 most-frequently appearing bulls were selected
Data (cont’d) • Herds needed ≥10 calving records with SB scores of 2 or 3 in the database to be included • Herd-years were required to include ≥20 records and only single births were used • Inclusion of all records for a cow was not guaranteed • The final dataset included 2,083,979 calving records from 5,765 herds and 33,304 herd-years
Sampling • Six datasets of ~250,000 records each were created by randomly sampling herd codes without replacement • Datasets ranged from 239,192 to 286,794 observations, and all averaged 7% stillbirths • A common pedigree file was used to facilitate comparisons between sire and MGS solutions
Heritabilities • Calving Ease (Direct) 8.6% • Calving Ease (MGS) 3.6% • Stillbirth (Direct) 3.0% • Stillbirth (MGS) 6.5%
Economic Assumptions • Newborn calf value • Expenses per difficult birth (CE ≥4)
Calving Ability Index • CA$ has a genetic correlation of 0.85 with the combined direct and maternal CE values in 2003 NM$ and 0.77 with maternal CE in TPI • Calving traits receive 6% of the total emphasis in NM$ (August 2006 revision)
Breeds Other Than Holstein • Brown Swiss economic values are −6 for SCE and −8 for DCE • Separate SB evaluations are not available • CE values include the correlated response in SB • Other breeds will be assigned CA$ of 0
Calving Ease Genetic CorrelationsService sire above diagonal, daughter below
Stillbirth Genetic CorrelationsService sire above diagonal, daughter below
Brown Swiss Calving Ease Service sire correlations above diagonal, daughter below
Index Conclusions • A routine evaluation for stillbirth in US Holsteins was implemented in August 2006 • Direct and maternal stillbirth were included in NM$ for Holsteins starting in August 2006 • August 2006 data were included in the September 2006 Interbull test run • The US will participate in routine Interbull evaluations beginning in November 2006
Abnormal Herd-Years • Many herd-years have abnormal distributions of scores • Two recent approaches to problem • Eliminate HY based on GoF tests • Collapse categories when mode > 1 • Both strategies improve prediction of later evaluations by earlier
An Illustration • Herds with unusual distributions of data affect evaluations of bulls • Worst case is when large share of records for a bull are in one “bad” herd • Herd reporting changes over time
Test Edits - c2GoF statistics • Based on multinomial distributions • Independent of herd size
Percentage of Score by Parity In All (AN) and GoF Excluded (AG) Herds 100 Parity 1 - AN 90 80 Parity 1 - AG 70 Parity 2 - AN 60 Counts by Herd-Parity (%) 50 Parity 2 - AG 40 30 20 10 0 1 2 3 4 5 Calving Ease Score
Collapse Categories • The mode for CE scores in a herd is expected to be 1, but was higher for nearly 10% of data • Data from herd-years with a mode of 4 or 5 (1.2%) were deleted • A mode of 3 is assumed to indicate that the scorer normalized the data (middle score of 3 for an 'average' birth)
Collapse Categories • Herds with a mode of 2 or 3: scores up to the mode were changed to 1, and scores greater than the mode were decreased accordingly • Herd-years with a mode of 3: scores 1-3 all become 1, scores of 4 are changed to 2, and scores of 5 are changed to 3 • Combining categories lowered the portion of difficult calvings and increased the impact of the subsequent goodness-of-fit test • Overall, 6.4% of data were excluded
Conclusions • Exclusion of herds with poor distributions improves prediction of future evaluations across birth years • Correlations across all data increased from .66 to .68 • Herds with poor score distributions were excluded uniformly across herd size • Exclusion of herds results in loss of evaluations for some bulls
Separate Parity Effects • First and later parities currently modelled as a single trait • cblup90iod only accepts one threshold trait • Options for bivariate analysis • Gibbs sampling (thrgibbs1) • Linearization (airemlf90) • RR on parity (cblup90iod)
Results • RR on a 0-1 parity effect does not account for heterogeneous variances • GS and AIREML solutions were similar • GS required more processing time than is desirable for routine national evaluations • The impact of the approximation necessary to linearize the scores is not known • Implementation of a bivariate analysis is desirable, but challenging
Acknowledgments • Jeff Berger, Iowa State University • John Clay, Dairy Records Management Systems • Ignacy Misztal and Shogo Tsuruta, University of Georgia • National Association of Animal Breeders