Download
1 / 9
90 likes | 92 Views
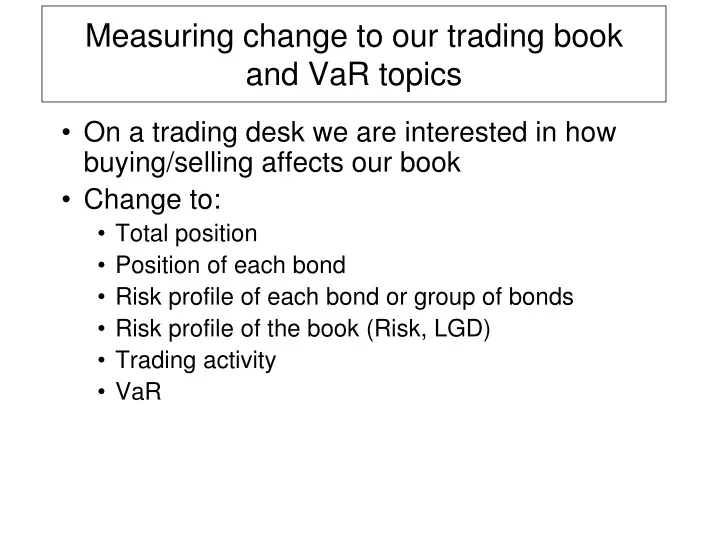
Measuring change to our trading book and VaR topics. On a trading desk we are interested in how buying/selling affects our book Change to: Total position Position of each bond Risk profile of each bond or group of bonds Risk profile of the book (Risk, LGD) Trading activity VaR.

E N D
Measuring change to our trading bookand VaR topics • On a trading desk we are interested in how buying/selling affects our book • Change to: • Total position • Position of each bond • Risk profile of each bond or group of bonds • Risk profile of the book (Risk, LGD) • Trading activity • VaR
How is VaR applied/validated? • Used to set “Limits” • Industry standard component to regulatory capital calculation • Multipliers - stress testing or just multiply VaR. • Validated by comparing to “clean” PnL (PnL due to market moves vs. fee based pnl) • We “backtest” by comparing to actual “clean” PnL • PnL can be attributed to 2 variables: • Spread (credit spread) • Yield (treasury rate) Good VaR quote: • “One to three times VaR are normal occurrences. You expect periodic VaR breaks. The loss distribution typically has fat tails, and you might get more than one break in a short period of time. … So an institution that can't deal with three times VaR losses as routine events probably won't survive long enough to put a VaR system in place. Three to ten times VaR is the range for stress testing. Institutions should be confident they have examined all the foreseeable events that will cause losses in this range, and are prepared to survive them. …Foreseeable events should not cause losses beyond ten times VaR. If they do they should be hedged or insured, or the business plan should be changed to avoid them, or VaR should be increased. It's hard to run a business if foreseeable losses are orders of magnitude larger than very large everyday losses. It's hard to plan for these events, because they are out of scale with daily experience. Of course there will be unforeseeable losses more than ten times VaR, but it's pointless to anticipate them, you can't know much about them and it results in needless worrying. Better to hope that the discipline of preparing for all foreseeable three-to-ten times VaR losses will improve chances for surviving the unforeseen and larger losses that inevitably occur. A risk manager has two jobs: make people take more risk the 99% of the time it is safe to do so, and survive the other 1% of the time. VaR is the border."
How is VaR applied? Cont… In April 1995, the Basle Committee came forth with another set of proposals,which was nothing short of a regulatory innovation: theInternal Model approach. For the firsttime banks would be allowed to use their own risk management models to determine their VaRand with it their capital requirement. This capital requirement follows simply by multiplying theVaR by an add-on factor. This add-on factor, sometimes called the“hysteriafactor”, may varybetween three and four, depending on the accuracy of the bank model in the past.The hysteriafactor is intended to provide additional protection against environments that are much less stablethan historical data would lead to believe. As a result of above banks set about justifying their risk models to regulators And of course they were motivated to reduce their regulatory capital
Problems with VaR David Einhorn and Aaron Brown debated VaR in theGlobal Association of Risk Professionals Review[14][23] Einhorn compared VaR to an: “Airbag that works all the time, except when you have a car accident” He further charged that VaR: • Led to excessive risk-taking and leverage at financial institutions • Focused on the manageable risks near the center of the distribution and ignored the tails • Created an incentive to take excessive but remote risks. • Was potentially catastrophic when its use creates a false sense of security among senior executives and watchdogs.
Credit Risk Component • Our credit risk measure is LGD “Loss Given Default” • For detailed coverage of LGD refer to online paper: • Basel Committee on Banking Supervision “An explanatory Note on the Basel II IRB Risk Weight Functions July 2005 • Expected Loss = Probability of Default * Loss Given Default • Probability of Default - per rating grade, which gives the average percentage of obligors that default in this rating grade in the course of one year • Loss Given Default - per rating grade, which gives the percentage of exposure the bank might lose in case the borrower defaults • EL = PD * LGD • LGD = EL / PD • We will measure LGD’s before and after ratings downgrades/upgrades!
Regulatory Capital • Capital is needed to cover the risks of peak losses, and therefore it has a loss absorbing function. (Black Jack analogy) • Good quote: “The worst case one could imagine would be that banks lose their entire credit portfolio in a given year. This event, though, is highly unlikely, and holding capital against it would be economically inefficient. Banks have an incentive to minimize the capital they hold, because reducing capital frees up economic resources that can be directed to profitable investments. On the other hand, the less capital a bank holds, the greater is the likelihood that it will not be able to meet its own debt obligations, i.e., that losses in a given year will not be covered by profit plus available capital, and that the bank will become insolvent. Thus banks and their supervisors must carefully balance the risks and rewards of holding capital.” • How to manage it? • Pricing of Credit Exposures (add a “vig”) • “Provisioning” (putting reserves from revenues aside) • Hedging with “protection” (insurance) - e.g., Credit Default Swaps
Deliverables for next week • Measure change of position intra-day • This will allow us to capture “new business” or trading • Two trading book files: • Opening position • Closing position • Calculate total position change – one integer number • Our “position” in the bond is the Amount of the bond • Calculate total LGD change - one integer number • Results for next week: • 2 numbers using two new trading book files on site • Single client call to your server • Performance measured on total round trip time of successive calls to the server – “real time” as measured by the client: • $time run.sh • Once we have the ability to measure daily change we will add the VaR measure (due in two weeks)
VaR Implementation Notes • Load historical data file – one per security in the trading book • You can hack at SBB_io .h/.cc • Build a separate “PnL Vector” for each bond • Assume all historical files will live in a sub dir “./var”. • For each SecID in our book(s), look up a file named “SecID.txt” in that sub dir • For ex., ./var/SBB_001.txt • Once you have a vector for each bond: • Add yield change to current yield to get new_price • The base_price is the price in the end-of-day file • daily_price_change = new_price - base_price • pnl_change = daily_price_change * Amount
VaR Implementation Notes... • Now that we have vectors for each bond how do we get book measure? • Add up individual bond vectors to get a total book vector • This method captures correlation between financial instruments • Ascending sort gives you largest negative PnL • Largest negative is the worst case loss • Our confidence interval and sample size will determine our VaR • The final step once you have a book PnL vector is which element to point to ... • There will be at least 100 daily changes • 99% confidence interval means your worst daily change is your VaR if 100 PnLs • Amount to multiply is either long or short (+ or -) • This means that a short position is a gain on a negative PnL day • Refer to : var_example.xls