Download
1 / 33
330 likes | 477 Views
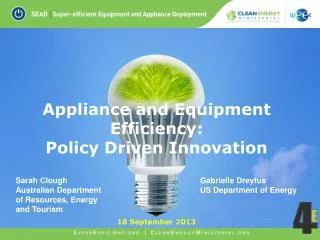
Appliance and Equipment Efficiency Standards for Florida. Jeff Sonne Senior Research Engineer Florida Solar Energy Center. Florida Solar Energy Center. Florida Solar Energy Center. Florida Solar Energy Center. Energy institute of the State of Florida Largest and most active in nation

E N D
Appliance and Equipment Efficiency Standards for Florida Jeff Sonne Senior Research Engineer Florida Solar Energy Center
Florida Solar Energy Center Florida Solar Energy Center • Energy institute of the State of Florida • Largest and most active in nation • 30-year history of research and training excellence • Approximately 150 staff • 90 professionals • 45 technical support and clerical staff • 15 graduate student assistants
Major Program Areas • Solar Thermal Heating System • Photovoltaics & Distributed Generation • Energy-Efficient Buildings • Hydrogen and Alternative Fuels • Education and Training
Overview • Cost Effective Energy Conservation Project • Federal and State Standards Background • Energy Use of Appliances • Standards Discussion / Input
Cost Effective Energy Conservation Project Intent is to: “provide technical, administrative and logistical support the Florida Building Commission and the Department of Community Affairs for energy conservation related tasks…directed by the Governor in Executive Order 07-127.”
Cost Effective Energy Conservation Project Four project tasks: • Develop model ordinance(s) to promote participation in “Green Building” programs • Evaluate the standard for energy efficiency of the Florida Energy Code and national model codes and standards • Develop a public awareness website • Identify and review new or updated energy conservation standards for products.
Cost Effective Energy Conservation Project Task 4: • “Identify efficiency improvements that could be anticipated by implementation of new standards consistent with the Governor’s Executive Order 07-127…” • “Identify potential energy efficiency standards for products and systems components that use electricity pursuant to…07-127…” • “…energy using products including, but not limited to, residential pool pumps, pool heaters, spas and commercial and residential appliances.”
17.6% 47.5% 34.9% Florida’s Energy Pie Distribution of Florida Primary Energy Use, 1999
2005 Florida Electricity Profile • Net Summer Capability: 53,220 MW • Net Generation: 220,256,411 MWh • Emissions • Carbon Dioxide: 130,325 Thousand MT • Nitrogen Oxide: 227 Thousand MT • Sulfur Dioxide: 412 Thousand MT Florida ranks 2nd of all states in net generation and 3rd in capability http://www.eia.doe.gov/cneaf/electricity/st_profiles/florida.html
2005 Florida Emissions Florida ranks 3rd in carbon dioxide and nitrogen oxide emissions http://www.eia.doe.gov/cneaf/electricity/st_profiles/florida.html
Florida Home Energy Use Parker, D., "Research Highlights from a Large Scale Residential Monitoring Study in a Hot Climate “ Florida Solar Energy Center, FSEC-pf-369-02, Jan. 01, 2002
Florida Home Energy Use In 1979 Other = 28% of total In 2007 Other = 52% of total Fairey, P., J. Sonne, "Effectiveness of Florida's Residential Energy Code: 1979 - 2007“ Florida Solar Energy Center, FSEC-CR-1717-07, May. 15, 2007
Florida Pool Energy Use 1999 utility study results showing pool electrical demand – 24% had pools with avg. use of 4,200 kWh/yr; 7% had electrically heated hot tubs with avg. use of 2,150 kWh/yr. Parker, D., "Research Highlights from a Large Scale Residential Monitoring Study in a Hot Climate “ Florida Solar Energy Center, FSEC-pf-369-02, Jan. 01, 2002
Home “Other” Use Increasing Utility study results showing lighting, refrigerator and plug loads use increased by an average of 8.2 Wh/day or about 17% over the 1999 monitoring period. Parker, D., "Research Highlights from a Large Scale Residential Monitoring Study in a Hot Climate “ Florida Solar Energy Center, FSEC-pf-369-02, Jan. 01, 2002
Standards Background • History of effective and successful state appliance and equipment efficiency standards starting in the 1970s (e.g. refrigerators) • Standards led to support for and enactment of national standards in 1987, 1988, 1992 and 2005 • Overall federal appliance and equipment efficiency standards projected to save 9.1% of total U.S. electricity use and reduce CO2emissions by 316 million metric tons in 2020 • Overall savings to consumers and businesses from these existing standards will approach $250 billion by 2020. Source: ACEEE / ASAP “Leading the Way” report, March 2006
Standards Selection • If a national standard exists, states can only enforce a tougher standard by first petitioning the U.S. DOE for a waiver • Thus our focus is on items not currently regulated and possibly those that DOE has not updated (transformer Final Rule 10/12/07) • Opportunities for greater saturation of efficient appliances or requirements not covered for that appliance.
Standards Selection * Specific standards not set, but DOE instructed to investigate whether standards were technically feasible and economically justified, and to set standards where these criteria were met. Source: ACEEE / ASAP “Leading the Way” report, March 2006
Standards Selection * Specific standards not set, but DOE instructed to investigate whether standards were technically feasible and economically justified, and to set standards where these criteria were met. Source: ACEEE / ASAP “Leading the Way” report, March 2006
Standards Selection Source: ACEEE / ASAP “Leading the Way” report, March 2006
Standards Selection • Provide significant and very cost-effective energy savings for purchasers/users • Readily available products that meet the standard • Easily developed and implemented at low cost to the state (either another state or national voluntary standard is already in use elsewhere). Source: ACEEE / ASAP “Leading the Way” report, March 2006
Sample Standards Leading the Way: Continued Opportunities for New State Appliance and Equipment Efficiency Standards March 2006 American Council for an Energy-Efficient Economy and Appliance Standards Awareness Project http://www.standardsasap.org/documents/leading_2006.htm
Sample Standards DVD Players and Recorders Standard • All DVD players and recorders will meet Energy Star maximum standby mode power level of 3 W • Incremental cost: $1 / 1.0 year payback • 2020 energy savings: 14.3 GWh • 2020 emissions reductions • CO2: 8,808 metric tons • NOx: 3.1 metric tons • SO2: 32.0 metric tons • Currently adopted in 3 states / pending in 2 states Source: ACEEE / ASAP “Leading the Way” report, March 2006
Sample Standards Single-Voltage External AC to DC Power Standard • Minimum active mode efficiency and maximum no-load mode energy consumption based on output Wattage. • Incremental cost: $0.5 / 1.2 year payback • 2020 energy savings: 279.4 GWh • 2020 emissions reductions • CO2: 169,187 metric tons • NOx: 59.7 metric tons • SO2: 624.7 metric tons • Currently adopted in 10 states / pending in 3 states Source: ACEEE / ASAP “Leading the Way” report, March 2006
Sample Standards State-Regulated Incandescent Reflector Lamps Standard • Most BR, BPAR, ER and R20 lamps meet the same efficacy requirements as R lamps (some exceptions) • Incremental cost: $1.0 / 0.1 year payback • 2020 energy savings: 327.5 GWh • 2020 emissions reductions • CO2: 198,547 metric tons • NOx: 69.9 metric tons • SO2: 732.2 metric tons • Currently adopted in 9 states / pending in 4 states Source: ACEEE / ASAP “Leading the Way” report, March 2006
Sample Standards Walk-In Refrigerators and Freezers Standard • Prescriptive standard based on CEC standard with insulation and lighting efficacy modifications • Incremental cost: $957 / 1.4 year payback • 2020 energy savings: 235.2 GWh • 2020 emissions reductions • CO2: 142,396 metric tons • NOx: 50.2 metric tons • SO2: 525.8 metric tons • Currently adopted in 5 states / pending in 4 states Source: ACEEE / ASAP “Leading the Way” report, March 2006
Sample Standards Gas-Fired Pool Heater Standard • Two-part standard that disallows constant burning pilot lights and requires a minimum 80% thermal efficiency • Incremental cost: $295 / 2.5 year payback • 2020 energy savings: 453.8 Million CF • 2020 emissions reductions • CO2: 21,286 metric tons • NOx: 7.1 metric tons • SO2: 0.1 metric tons • National standard thermal efficiency minimum is 78% (requires waiver); California prohibits constant burning pilot lights Source: ACEEE / ASAP “Leading the Way” report, March 2006
Sample Standards Portable Electric Spas Standard • Maximum standby energy consumption of 5 * (V2/3) Watts where “V” is spa volume • Incremental cost: $100 / 4.2 year payback • 2020 energy savings: 6.8 GWh • 2020 emissions reductions • CO2: 4,037 metric tons • NOx: 1.5 metric tons • SO2: 15.2 metric tons • Currently adopted in 3 states / pending in 1 state Source: ACEEE / ASAP “Leading the Way” report, March 2006
Sample Standards Residential Pool Pumps Standard • Two-part standard that bans split-phase and capacitor start-induction run motors, and requires two-speed pumps/controls • Incremental cost: $664 / 6.5 year payback • 2020 energy savings: 768 GWh • 2020 emissions reductions • CO2: 579,126 metric tons • NOx: 699.1 metric tons • SO2: 1,831.1 metric tons • Currently adopted in 2 states / pending in 1 state Source: ACEEE / ASAP “Leading the Way” report, March 2006