Download
1 / 7
80 likes | 149 Views
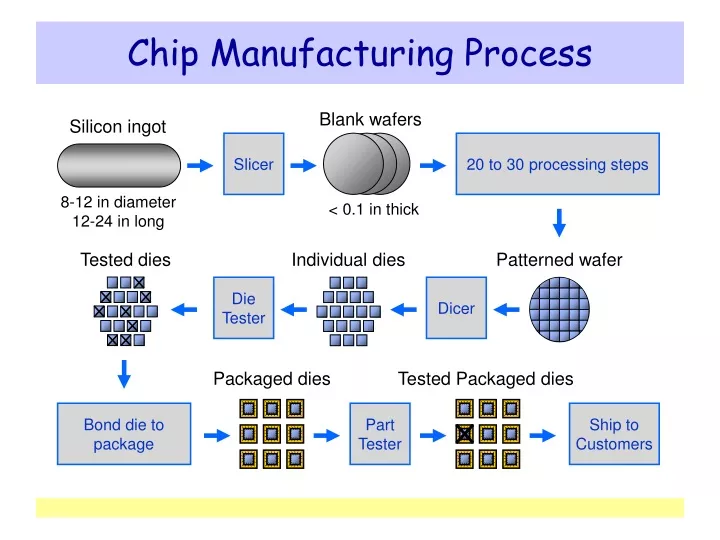
Blank wafers. Silicon ingot. Slicer. 20 to 30 processing steps. 8-12 in diameter 12-24 in long. < 0.1 in thick. Tested dies. Patterned wafer. Individual dies. Die Tester. Dicer. Packaged dies. Tested Packaged dies. Bond die to package. Part Tester. Ship to Customers.

E N D
Blank wafers Silicon ingot Slicer 20 to 30 processing steps 8-12 in diameter 12-24 in long < 0.1 in thick Tested dies Patterned wafer Individual dies Die Tester Dicer Packaged dies Tested Packaged dies Bond die to package Part Tester Ship to Customers Chip Manufacturing Process
Wafer of Pentium 4 Processors • 8 inches (20 cm) in diameter • Die area is 250 mm2 • About 16 mm per side • 55 million transistors per die • 0.18 μm technology • Size of smallest transistor • Improved technology uses • 0.13 μm and 0.09 μm • Dies per wafer = 169 • When yield = 100% • Number is reduced after testing • Rounded dies at boundary are useless
Defective Die Good Die 1 Yield = (1 + (Defect per area Die area / 2))2 Effect of Die Size on Yield Dramatic decrease in yield with larger dies Yield = (Number of Good Dies) / (Total Number of Dies) Die Cost = (Wafer Cost) / (Dies per Wafer Yield)
Technology Improvements • Vacuum tube → transistor → IC → VLSI • Processor • Transistor count: about 30% to 40% per year • Memory • DRAM capacity: about 60% per year (4x every 3 yrs) • Cost per bit: decreases about 25% per year • Disk • Capacity: about 60% per year • Opportunities for new applications • Better organizations and designs
Growth of Capacity per DRAM Chip • DRAM capacity quadrupled almost every 3 years • 60% increase per year, for 20 years
Workstation Performance Improvement is between 50% and 60% per year More than 1000 times improvement between 1987 and 2003