Download

1 / 27
270 likes | 282 Views
ANALYTICAL METHODS IN MAINTENANCE. What Maintenance Analysis method Examples of Using Maintenance Data. Maintenance Analysis. Dependant upon criticality, differing levels of analysis effort should be applied. For the top 5-10% quantities risk and performance analysis may be warranted.

E N D
ANALYTICAL METHODS IN MAINTENANCE What Maintenance Analysis method Examples of Using Maintenance Data
Maintenance Analysis Dependant upon criticality, differing levels of analysis effort should be applied. For the top 5-10% quantities risk and performance analysis may be warranted For the next 40-50% use template a rule-based methods (such as RCM). At the lower levels of criticality, not even simple analysis is worthwhile, and instead may rely on manufacturer’s recommendations or retain current practice.
For the top 5-10% quantities risk and performance analysis may be warranted: ANALYSIS/SIMULATION SOFTWARE ** SIMLOX Powerful and versatile simulation tool for event based simulation and analysis of complex operational and logistic support operations. Provides graphs on system availability, resources utilisation, actual versus requested mission time, etc. www.systecon.se ** LOGAN Monte Carlo simulation tool Evaluates availability of complex systems. Can include effect of manning levels, spares holdings, redundant and standby systems, etc. www.reliability-safety-software.com
For the top 5-10% quantities risk and performance analysis may be warranted: AvSim+ • AvSim+ is an availability simulation and system optimisation tool developed specifically to handle the complexity of large plants and systems. • It uses Monte-Carlo simulation to calculate the expected system reliability, availability and capacity performance over a chosen life cycle. www.reliability.com.au
Maintenance PLANS: Horses for Courses Dependant upon criticality, differing levels of analysis effort should be applied. For the top 5-10% quantities risk and performance analysis may be warranted For the next 40-50% use template a rule-based methods (such as RCM).
RCM SOFTWARE ** RCM Turbo Australian owned and developed expert methodology for the implementation of reliability centred maintenance strategies. A unique decision support platform leading directly to new schedules. www.strategicorp.com
Log Scatterplot of mean repair times versus number of failureswith limit values. “Downtime Priorities, Jack-Knife Diagrams and the Business Cycle” Peter Knights, May 2004 issue The Maintenance Journal
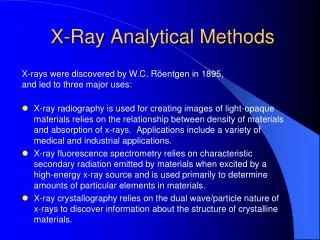
Casing seal Bearing 1 Bearing 2 coupling Shaftseal ELECTRIC MOTOR GEAR BOX
Casing seal Bearing 1 Bearing 2 coupling Shaftseal ELECTRIC MOTOR GEAR BOX Failures over a 48 month period :-
Casing seal Bearing 1 Bearing 2 coupling Shaftseal ELECTRIC MOTOR GEAR BOX
1st failure at 190 hrs 2nd failure at 205 hrs 3rd failure at 3705 hrs 4000hrs 0hrs
1st failure at 190hrs 2nd failure at 205hrs 3rd failure at 3705hrs 0hrs 4000hrs 8000hrs 12000hrs 16000hrs 20000hrs 24000hrs 28000hrs 32000hrs
BEARING 2 WORST BEST *RANKED ORDER*
HISTOGRAM OF BEARING No.2 FAILURES NUMBER OF FAILURES
WEIBULL ANALYSIS • It allows analysis of HOW COMPONENTS FAIL. • If it is found that failure is AGE RELATED then you can also identify the optimum REPLACEMENT INTERVAL
BEARING 2 *RANKED ORDER*
WEIBULL ANALYSISRELCODE Data Analysis Software RELCODE is a software package for Weibull analysis of Failure Data. www.albanyint.com.au
MONTE CARLO SIMULATION 6 NUMBER OF FAILURES 5 4 7 1 2 3 • Use random numbers to recreate the failures • Number range 1 to 7 • If No. 1 then this is a failure at 2500 hrs
1st failure at 2500 hrs 0hrs
$100020 hrs 6 NUMBER OF FAILURES 5 4 7 1 2 3 Add repair hrs and cost data
1st failure at 2500 hrs Repaired at 2520 hrscost $1000 0hrs • Using more random numbers you can continue generating failures and repair/cost data. • You may test a number of fixed time replacement events, test which failures they will prevent and see which replacement time is cost effective. • You can run the simulation for 100yrs for 1000 similar machines operating in parallel and establish number of man hrs per week required to maintain the machines.