Download
1 / 40
400 likes | 402 Views
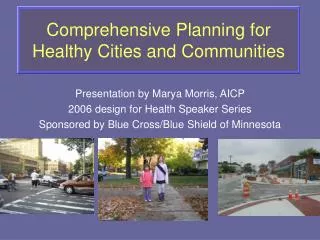
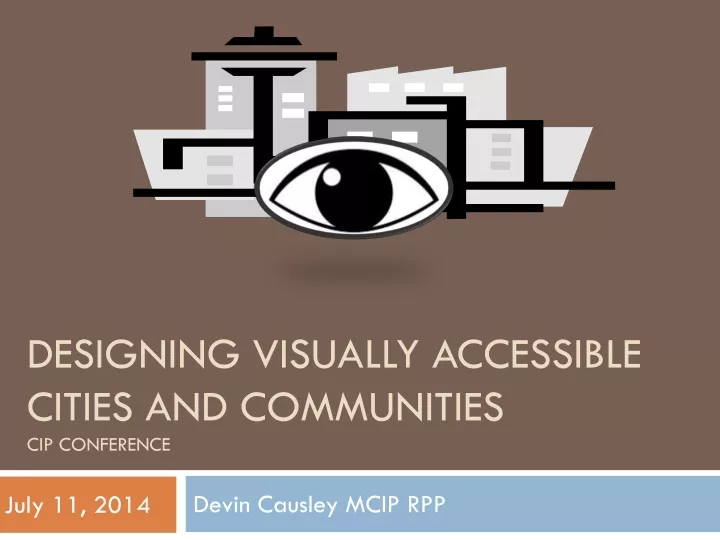
Explore the importance of designing visually accessible cities and communities for individuals with low vision and blindness. This conference will cover topics such as wayfinding, street signage, maps, and other elements that contribute to making a city more accessible. Join Devin Causley, MCIP, RPP, on July 11, 2014, to learn how to create inclusive spaces for all.

E N D
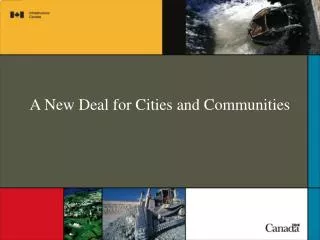
Designing Visually Accessible Cities and CommunitiesCIP Conference Devin Causley MCIP RPP July 11, 2014
Outline • Icebreaker – Elements of a visual city? • Low Vision and Blindness. • Designing for Visual Accessibility. • Wayfinding. • The Role of Planners? • Video – Design with the Blind in Mind • Chris Downey • Questions?
What do we know already? • Answering the question: What can be done to help make a city visually accessible? • Use sticky pads provided write down one idea on each pad about what you think would help make a city more accessible. • Pass them to the front on the room.
Vision • There are approx 1.1 million people in Canada living with blindness or partial sight • Degree of vision loss can impact economic opportunities and social interaction • 70% of blind or visually impaired people are unemployed • Portion of population with vision loss is growing • Most live normal, functional lives
Vision • Vision loss refers to individuals who have trouble seeing, even with correction, and individuals who are blind or unable to see. • Visual impairment is often defined clinically as a visual acuity of 20/70 or worse in the better eye with best correction, or a total field loss of 140 degrees. • Low vision is a term often used interchangeably with visual impairment and refers to a loss of vision that may be severe enough to hinder an individual's ability to complete daily activities while still retaining some degree of useable vision. • Legal blindness is a level of vision loss that has been legally defined to determine eligibility for benefits. The clinical diagnosis refers to a central visual acuity of 20/200 or less in the better eye with the best possible correction, and/or a visual field of 20 degrees or less. • Total blindness refers to an inability to see anything with either eye.
Causes of Vision Loss • Vision loss can be caused by eye problems that are present from birth, by conditions that appear later in life, or by infections or environmental factors. Eye Connect Aging Eyes AMD Astigmatism Cataracts Charles Bonnet syndrome Diabetic Eye Disease Diabetic Macular Edema Dry Eye Far-Sightedness Floaters & Flashing Lights Glaucoma Lazy Eye (Amblyopia) Near-Sightedness Pink Eye Retinal Detachment Retinal Pigmentosa Retinal Vein Occlusion
Supporting Agencies • Canadian National Institute for the Blind • Community support services for blind and low vision • National advocacy • Canadian Council for the Blind • National advocacy with government and consumer organizations • Support agency
Braille • Textured language consisting of dots used by the blind and people with low vision • Used to communicate street names, describe locations and signals
Street Signage, Maps and Directions • Use signs, maps and directions in combination • Make signs clear and easy to read • Frequent and consistent locations • Follow standard signage conventions • Distinct signs for vehicles, cyclists and pedestrians
Street / Information Signs • Large print • High contrasting colours • Differentiate with colour • Close to eye level • Audible or interactive Read Me Read Me Read Me
Navigation Maps • Help pedestrians find their way around. • Large and non-cluttered • Provide key symbols • Reference to points of interest • Frequent locations • Easy to identify – consistent colour, shape, size
Sidewalk Texturing and Colouring • Use changes in texture to communicate changes in grade, stairs or intersections. • Can be felt by feet or canes • Apply colours to the ground to indicate zones or pathways. • Sidewalks are a canvas, use them for messages. • Be creative!
Audible Signals and Messages • Use sounds or narration to communicate key points or warnings • Intersection crossing signals (beeps) • Adequate timing • Countdowns • Consistent location • Pedestrian priority
Audio GuidesZero Project, Austria • Combining GPS and RFID tags to assist navigation • Designed for public transport, expanding to inter-modal systems. • Designed as an app for mobile devices
Safe Zones • Combine these elements to form a sense of security • Add generous space for pedestrians – room for mobility • Separation from vehicles and cyclists • Dog friendly
What is Wayfinding? • Wayfinding enables people to orient themselves and navigate from place to place with ease. • Wayfinding is more than signs. • Working together with other elements of the public realm such as street furniture and public art, it includes names, landmarks, conventions, maps and new media. It contributes to making a city more "legible" for residents, commuters, and tourists alike. (City of Toronto)
Branding • Think of the city or neighbourhood as a mall • Distinct yet consistent identity • Welcoming and recognizable • Complementary maps, signs and technology
Connecting People to Places • What is nearby that might be of interest? • Shops, services, tourism • What is coming up next along their path? • Accessibility, tourism, economic development share complementary objectives.
Design • Adopt urban design guidelines, setbacks and neighbourhood designs embracing accessibility. • Encourage the development of new standards scaled to pedestrians
Barrier Free Design • Universal Design - Ronald L. Mace, Architect • Designing all products and the built environment to be aesthetic and usable to the greatest extent possible by everyone, regardless of their age, ability, or status in life. • Designing for the Disabled - Selwyn Goldsmith • Inventor of the dropped curb design • Seven Principles • Equitable use • Flexibility in use • Simple and intuitive • Perceptible information • Tolerance for error • Low physical effort • Size and space for approach and use
Engage • Engage urban designers, architects and engineers to integrate accessibility. • Engage blind, low vision and people with disabilities to develop and test designs
Change Micro Macro
Questions? • Devin Causley MCIP RPP • P: 613-255-6120 • E: causleyd@rogers.com