Download
1 / 22
220 likes | 372 Views
Section 2-1: Linear and Quadratic Functions and Modeling. Chapter 2: Polynomial, Power, and Rational Functions. Objectives. You will learn about: Polynomial Functions Linear Functions and Their Graphs Average Rate of Change Linear Correlation and Modeling

E N D
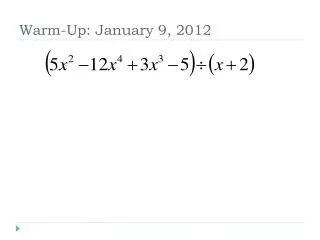
Section 2-1: Linear and Quadratic Functions and Modeling Chapter 2:Polynomial, Power, and Rational Functions
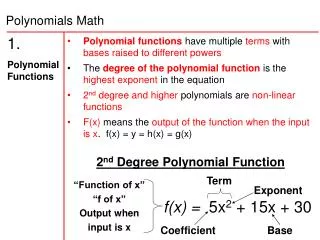
Objectives • You will learn about: • Polynomial Functions • Linear Functions and Their Graphs • Average Rate of Change • Linear Correlation and Modeling • Quadratic Functions and Their Graphs • Applications of Quadratic Functions • Why? • Many business and economic problems are modeled by linear functions. Quadratic functions and higher degree polynomial functions are used to model some manufacturing applications.
Vocabulary • Polynomial function of degree n • Leading coefficient • Linear function • Slant line • Average rate of change • Rate of change • Initial value of x • Constant term • Linear correlation • Positive linear correlation • Negative linear correlation • (linear) correlation coefficient r • Axis of symmetry (axis) • Vertex • Standard quadratic form • Vertex form • Height • Vertical velocity • Acceleration due to gravity
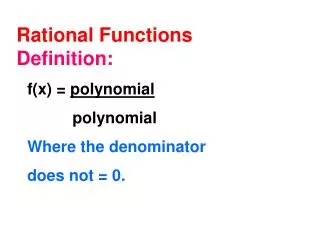
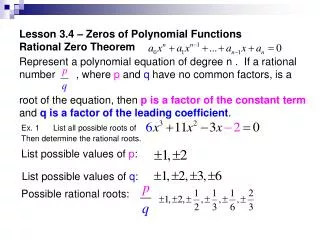
Polynomial Function • Let n be a nonnegative integer and let a0, a1, a2……..an-1, an with an≠ 0. • The function given by: • f(x) = anxn + an-1xn-1 +……. a2x2 + a1x1 + a0x0 is a polynomial function of degree n. The leading coefficient is an. • The zero function f(x) = 0 is a polynomial function. It has no degree and no leading coefficient.
Example 1Identifying Polynomial Functions • Which of the following are polynomial functions? For those that are polynomial functions, state the degree and leading coefficient. For those that are not, explain why.
Slant Line • A line in the Cartesian plane is the graph of a linear function if and only if it is a slant line, that is, neither horizontal nor vertical.
Example 2Finding an Equation of a Linear Function • Write an equation for the linear function f such that f(-1) = 2 and f(3) = -2.
Average Rate of Change • The average rate of change of a function y = f(x) between x = a and x = b; a ≠ b is:
Theorem:Constant Rate of Change • A function defined on all real numbers is a linear function if and only if it has a constant nonzero average rate of change between any two points on its graph. • Note: The constant rate of change is the slope of the line.
Linear Correlation • A linear correlation is when points on a scatter plot are clustered along a line. • Positive correlation- positive slope • Negative correlation- negative slope
Linear Correlation Coefficient (r) • A number that measures the strength and direction of the linear correlation of a data set. • To find r: • Finding r
Properties of the Correlation Coefficient r • -1 ≤ r ≤ 1 • When r > 0, there is a positive linear correlation • When r < 0, there is a negative linear correlation • When |r| ≈ 1, there is strong linear correlation • When r ≈ 0, there is weak or no linear correlation
Example 3Modeling and Predicting Demand • Write a linear model for demand (in boxes sold per week) in terms of the price per box (in dollars) Describe the strength and direction of the linear correlation. Then use the model to predict weekly cereal sales if the price is dropped to $2.00 or raised to $4.00
Regression Analysis • Enter and plot the data (scatter plot). • Find the regression model that fits the problem situation. • Superimpose the graph of the regression model on the scatter plot and observe the fit. • Use the regression model to make predictions called for in the problem.
Example 4Transforming the Squaring Function • Describe how to transform the graph of f(x) = x2 into the graph of the given function. Sketch its graph by hand.
Vertex Form of a Quadratic Function • Any quadratic function f(x)=ax2 + bx + c, a ≠ 0 can be written in the form: • f(x) = a(x-h)2 + k • The graph of f is a parabola with vertex (h,k) and axis x = h where • h=-b/(2a) • k=c-ah2 • If a > 0 the parabola opens upward • If a < 0 the parabola opens downward
Example 5Finding the Vertex and Axis of a Quadratic Function • Use the vertex form of a quadratic function to find the vertex and axis of the graph of f(x) =6x – 3x2 – 5 • Re-write the equation in vertex form.
Example 6Using Algebra to Describe the Graph of a Quadratic Function • Use completing the square to describe the graph of f(x) = 3x2 + 12x +11
Example 7Predicting Maximum Revenue • Use the model y = -15,358.93x + 73,622.50 to develop a model for the weekly revenue generated by doughnut shaped oat breakfast cereal sales. Determine the maximum value and how to achieve it.
Vertical Free-Fall Motion • The height s and the vertical velocity v of an object in free fall are given by: • s(t) =__________________ • v(t)=__________________ • Where: • t is time (in seconds) • g=32 ft/sec2 or g=9.8 ft/sec2 is the acceleration due to gravity • v0 is the initial vertical velocity • s0 is the initial height
Example 8Modeling Vertical Free-Fall Motion • Use the table to write models for the height and vertical velocity of the rubber ball. Then use these models to predict the maximum height of the ball and its vertical velocity.