Download
1 / 2
20 likes | 91 Views
Abstract.

E N D
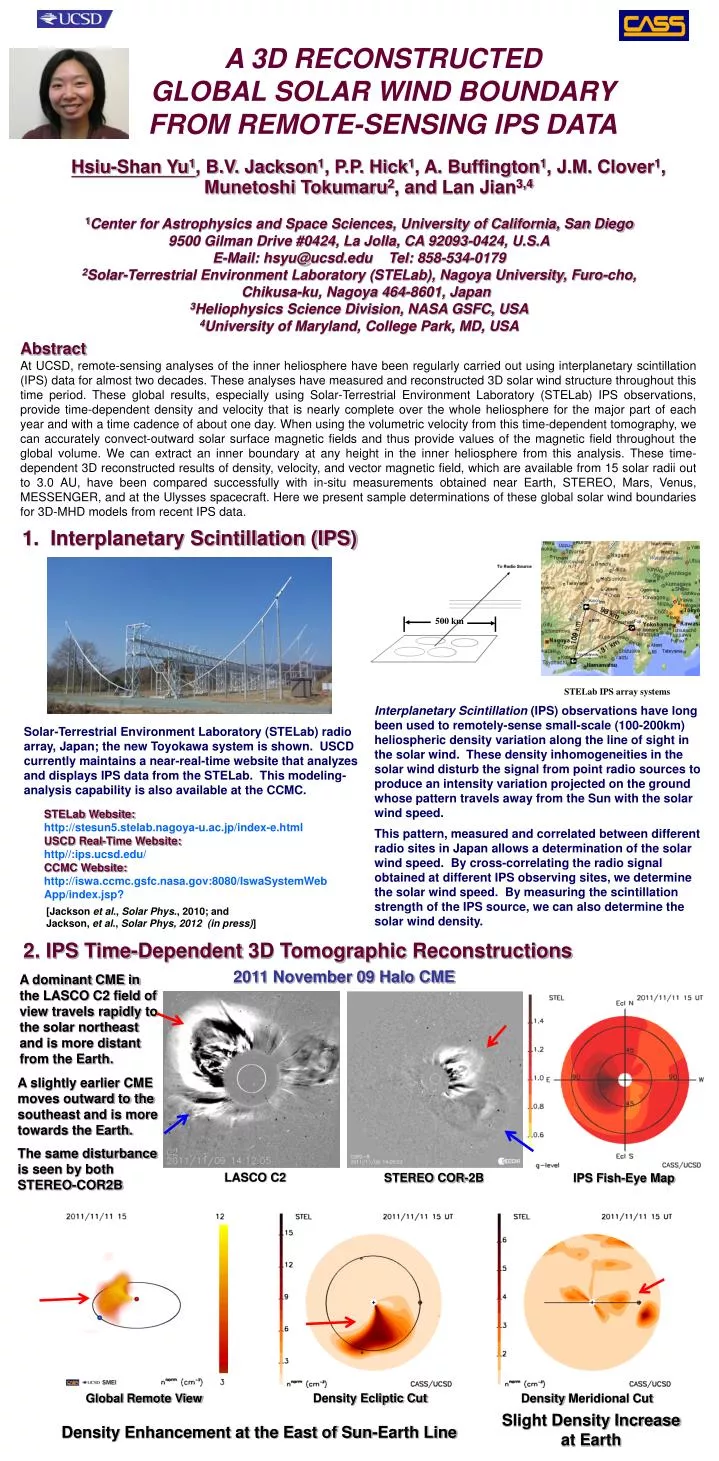
Abstract At UCSD, remote-sensing analyses of the inner heliosphere have been regularly carried out using interplanetary scintillation (IPS) data for almost two decades. These analyses have measured and reconstructed 3D solar wind structure throughout this time period. These global results, especially using Solar-Terrestrial Environment Laboratory (STELab) IPS observations, provide time-dependent density and velocity that is nearly complete over the whole heliosphere for the major part of each year and with a time cadence of about one day. When using the volumetric velocity from this time-dependent tomography, we can accurately convect-outward solar surface magnetic fields and thus provide values of the magnetic field throughout the global volume. We can extract an inner boundary at any height in the inner heliosphere from this analysis. These time-dependent 3D reconstructed results of density, velocity, and vector magnetic field, which are available from 15 solar radii out to 3.0 AU, have been compared successfully with in-situ measurements obtained near Earth, STEREO, Mars, Venus, MESSENGER, and at the Ulysses spacecraft. Here we present sample determinations of these global solar wind boundaries for 3D-MHD models from recent IPS data. A 3D RECONSTRUCTED GLOBAL SOLAR WIND BOUNDARY FROM REMOTE-SENSING IPS DATA Hsiu-Shan Yu1, B.V. Jackson1, P.P. Hick1, A. Buffington1, J.M. Clover1, Munetoshi Tokumaru2, and Lan Jian3,4 1Center for Astrophysics and Space Sciences, University of California, San Diego 9500 Gilman Drive #0424, La Jolla, CA 92093-0424, U.S.A E-Mail: hsyu@ucsd.edu Tel: 858-534-0179 2Solar-Terrestrial Environment Laboratory (STELab), Nagoya University, Furo-cho, Chikusa-ku, Nagoya 464-8601, Japan 3Heliophysics Science Division, NASA GSFC, USA 4University of Maryland, College Park, MD, USA 1. Interplanetary Scintillation (IPS) 500 km Interplanetary Scintillation (IPS) observations have long been used to remotely-sense small-scale (100-200km) heliospheric density variation along the line of sight in the solar wind. These density inhomogeneities in the solar wind disturb the signal from point radio sources to produce an intensity variation projected on the ground whose pattern travels away from the Sun with the solar wind speed. Solar-Terrestrial Environment Laboratory (STELab) radio array, Japan; the new Toyokawa system is shown. USCD currently maintains a near-real-time website that analyzes and displays IPS data from the STELab. This modeling-analysis capability is also available at the CCMC. STELab Website: http://stesun5.stelab.nagoya-u.ac.jp/index-e.html USCD Real-Time Website:http//:ips.ucsd.edu/CCMC Website: http://iswa.ccmc.gsfc.nasa.gov:8080/IswaSystemWebApp/index.jsp? This pattern, measured and correlated between different radio sites in Japan allows a determination of the solar wind speed. By cross-correlating the radio signal obtained at different IPS observing sites, we determine the solar wind speed. By measuring the scintillation strength of the IPS source, we can also determine the solar wind density. [Jackson et al., Solar Phys., 2010; and Jackson, et al., Solar Phys, 2012 (in press)] 2. IPS Time-Dependent 3D Tomographic Reconstructions 2011 November 09 Halo CME A dominant CME in the LASCO C2 field of view travels rapidly to the solar northeast and is more distant from the Earth. STELab IPS array systems A slightly earlier CME moves outward to the southeast and is more towards the Earth. The same disturbance is seen by both STEREO-COR2B LASCO C2 STEREO COR-2B IPS Fish-Eye Map Density Ecliptic Cut Global Remote View Density Meridional Cut Slight Density Increase at Earth Density Enhancement at the East of Sun-Earth Line
3. Global Solar Wind Boundary We can accurately convect-outward solar surface magnetic fields and thus provide values of the field throughout the global volume by using the IPS velocity analyses (see Jackson et al. Poster). These extrapolations allow an immediate location and a track of any remote heliospheric position to the inner boundary surface in order to estimate potential solar particle propagation paths. 0.25AU Density Ecliptic Cut, nnorm (cm-3) Radial Magnetic Field, Bnormr (nT) The dashed circle shows the inner boundary and the solid Sun to Earth line shows the convection trace. Dunn, T., et al., Solar Phys., 2005 Jackson et al., Adv. in Geosciences, 2012 (in press) Time-Dependent Boundary at 0.25 AU in Inertial Heliographic Coordinates (IHG) The Earth location in 3.31o N, 333o at 1 AU () and its projection at 0.25 AU in 3.31o N, 12.1o () are marked on these synoptic maps showing the structures present at the location of the projection. The density and velocity synoptic maps at 0.25 AU (a, b) show a relatively dense and high speed structure near the Earth projected location of the propagation path of the solar energetic particles. ACE Level-2 datashow a strong increase of flux starting around 11 November (arrow). Below, our density and velocity reconstruc-tions show good agreement with the ACE in-situ data at 1AU. 4. Summary and Discussion • The analysis of IPS data provides low-resolution global measurements of density and velocity with a time cadence of one day for both density and velocity, and slightly longer cadences for some magnetic field components. • There are several data sources (IPS, SMEI), but the most long-term and substantiated source (that also measures velocity globally) is IPS data from the STELab arrays in Japan. • Accurate observations of inner heliosphere parameters coupled with the best physics can extrapolate these outward to Earth or the interstellar boundary. • For current specific applications it is best to certify that there are high-quality data (both remotely-sensed and in situ) available for the periods of study, especially when using these analyses as a lower boundary for 3D-MHD forward-modeling techniques. References Dunn, T., Jackson, B.V., Hick, P.P., Buffington, A., and Zhao, X.P., 2005, “Comparative Analyses of the CSSS Calculation in the UCSD Tomographic Solar Observations”, Solar Phys., 227, 339-353. Jackson, B.V., Hick, P.P., Bisi, M.M., Clover, J.M., and Buffington, A., 2012, “Inclusion of Real-Time in-situ Measurements into the UCSD Time-Dependent Tomography and Its Use as a Forecast Algorithm”, Solar Phys., (in press). Jackson, B.V., Hick, P.P., Buffington, A., Clover, J.M., and Tokumaru, M.,2012, “Forecasting Transient Heliospheric Solar Wind Parameters at the Locations of the Inner Planets’”, Adv. in Geosciences,(in press).