Download
1 / 2
20 likes | 144 Views
Abstract.

E N D
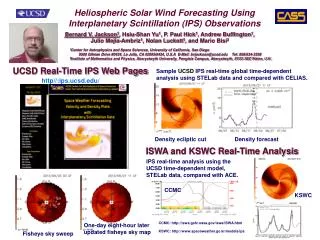
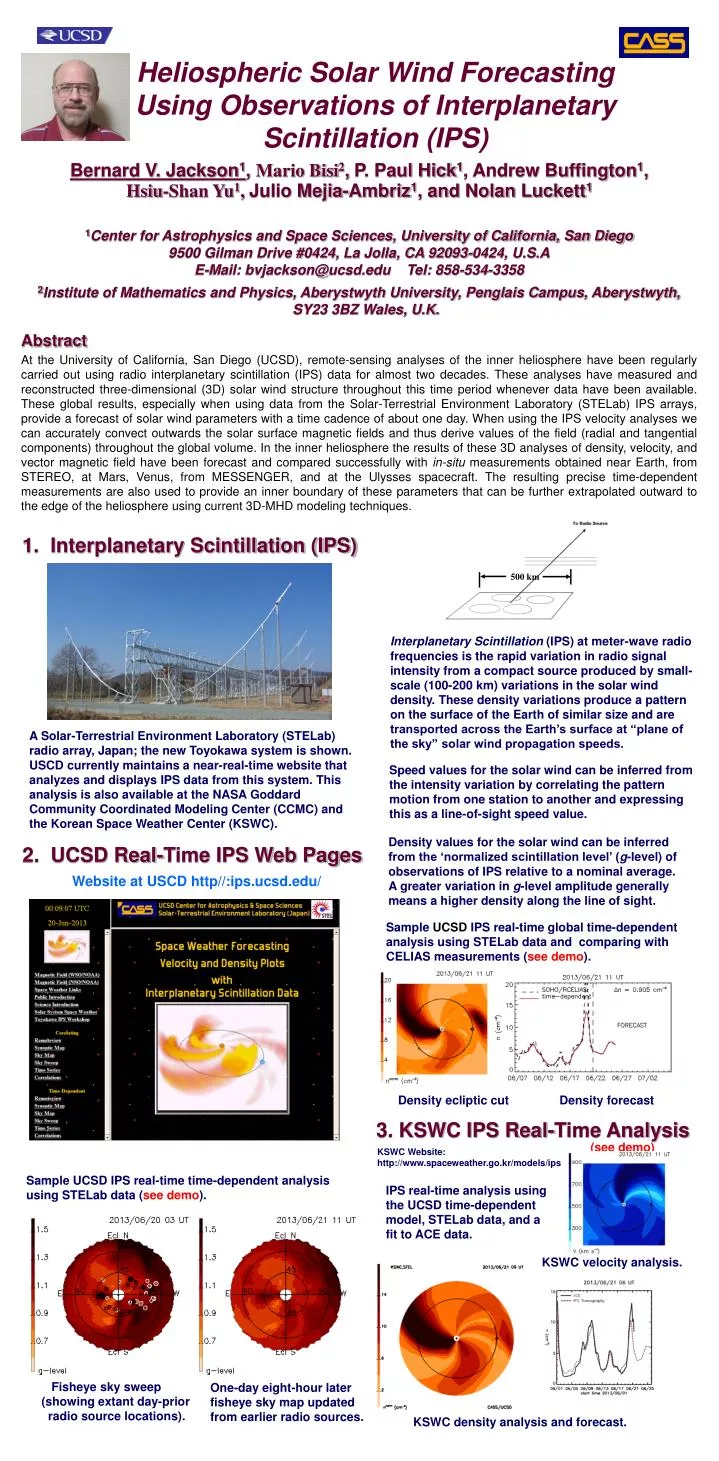
Abstract At the University of California, San Diego (UCSD), remote-sensing analyses of the inner heliosphere have been regularly carried out using radio interplanetary scintillation (IPS) data for almost two decades. These analyses have measured and reconstructed three-dimensional (3D) solar wind structure throughout this time period whenever data have been available. These global results, especially when using data from the Solar-Terrestrial Environment Laboratory (STELab) IPS arrays, provide a forecast of solar wind parameters with a time cadence of about one day. When using the IPS velocity analyses we can accurately convect outwards the solar surface magnetic fields and thus derive values of the field (radial and tangential components) throughout the global volume. In the inner heliosphere the results of these 3D analyses of density, velocity, and vector magnetic field have been forecast and compared successfully with in-situ measurements obtained near Earth, from STEREO, at Mars, Venus, from MESSENGER, and at the Ulysses spacecraft. The resulting precise time-dependent measurements are also used to provide an inner boundary of these parameters that can be further extrapolated outward to the edge of the heliosphere using current 3D-MHD modeling techniques. Heliospheric Solar Wind Forecasting Using Observations of Interplanetary Scintillation (IPS) Bernard V. Jackson1, Mario Bisi2,P. Paul Hick1, Andrew Buffington1, Hsiu-Shan Yu1,Julio Mejia-Ambriz1, and Nolan Luckett1 1Center for Astrophysics and Space Sciences, University of California, San Diego 9500 Gilman Drive #0424, La Jolla, CA 92093-0424, U.S.A E-Mail: bvjackson@ucsd.edu Tel: 858-534-3358 2Institute of Mathematics and Physics, Aberystwyth University, Penglais Campus, Aberystwyth, SY23 3BZ Wales, U.K. 1. Interplanetary Scintillation (IPS) 500 km Interplanetary Scintillation (IPS) at meter-wave radio frequencies is the rapid variation in radio signal intensity from a compact source produced by small-scale (100-200 km) variations in the solar wind density. These density variations produce a pattern on the surface of the Earth of similar size and are transported across the Earth’s surface at “plane of the sky” solar wind propagation speeds. A Solar-Terrestrial Environment Laboratory (STELab) radio array, Japan; the new Toyokawa system is shown.USCD currently maintains a near-real-time website that analyzes and displays IPS data from this system. This analysis is also available at the NASA Goddard Community Coordinated Modeling Center (CCMC) and the Korean Space Weather Center (KSWC). Speed values for the solar wind can be inferred from the intensity variation by correlating the pattern motion from one station to another and expressing this as a line-of-sight speed value. Density values for the solar wind can be inferred from the ‘normalized scintillation level’ (g-level) of observations of IPS relative to a nominal average. A greater variation in g-level amplitude generally means a higher density along the line of sight. 2. UCSD Real-Time IPS Web Pages Website at USCD http//:ips.ucsd.edu/ Sample UCSD IPS real-time global time-dependent analysis using STELab data and comparing with CELIAS measurements (see demo). Density ecliptic cut Density forecast 3. KSWC IPS Real-Time Analysis (see demo) KSWC Website: http://www.spaceweather.go.kr/models/ips Sample UCSD IPS real-time time-dependent analysis using STELab data (see demo). IPS real-time analysis using the UCSD time-dependent model, STELab data, and a fit to ACE data. jet KSWC velocity analysis. jet Fisheye sky sweep(showing extant day-prior radio source locations). One-day eight-hour later fisheye sky map updated from earlier radio sources. KSWC density analysis and forecast.
(See Jackson et al., 2010, Solar Phys., 265, 245-256; Jackson et al., Solar Phys., 2013, (published on line ) doi: 10.1007/s11207-012-0102-x) 4. Inclusion of In-situData Sample forecasts (see demo). The inclusion of in-situ data in the 3D reconstructions from recent STELab IPS data provides very accurate “aftcasts”. There is less of a change from in-situ real-time measurements to those remotely-sensed, and the blend from in-situ measurements into the 3D tomography is seamless. Density and velocity forecasts incorporating CELIAS density in-situ measurements. Velocity aftcast correlation Density aftcast correlation Velocity forecast correlation Density forecast correlation Velocity Density 5. Magnetic Field Extrapolation Traceback to the Source Surface. Also runs in real time (see demo). Projection onto the Source Surface CSSS Model Source Surface The Current-Sheet Source-Surface (CSSS) extension to the potential field model provides a way for the IPS time-dependent tomographic analysis to incorporate the kinematic model mass and mass-flux conservation into the extrapolation of the source surface field outward. A traceback to the surface along field lines is available. EIT 195 IPS velocity ecliptic cut Dunn, T., et al., 2005, Solar Phys., 227, 339–353. Jackson, B.V., et al., 2011, Adv. in Geosciences, 30, 93-115. Zhao, X. P. and Hoeksema, J. T., 1995, J. Geophys. Res., 100 (A1), 19. 6. Ongoing Projects Validation of IPS analyses - velocity, density, and magnetic field (archival). In-Situ (OMNI)Tomographic analysis In-SituTomographic analysis In-SituTomographic analysis Jian, L., et al., 2012, PS-ST25-A006 AOGS presentation, Singapore, 13-17 August, 2012. Sample Lan Jian ( ) CCMC study - superimposed Carrington plots from CR 2056-2063: in-situ left, 3D reconstruction right. MEXART data incorporation into the IPS analysis. With Without Shown is a fisheye sky map showing a MEXART (Mexico) radio source inserted into the UCSD volumetric analysis that incorporates a line-of-sight weighting appropriate to provide an inclusion in the volume. For this data set during a quiet time period, the source adds information and blends into the background without significantly changing the volume or the perpendicular-to-the-sky 2D velocity sky map. Presentation of Faraday rotation measurements of magnetic field from these analyses. Sample Faraday rotation (FR) sky maps from the UCSD time-dependent density model and background vector fields for use in matching heliospheric FR. (a) Background field and daily updated density. (b) Same field with a flux rope cylinder superimposed on the background field and daily updated densities. (b) (a) Time-dependent inner boundary (IHG coordinates). Wu, S.T., et al.,2001, J. Geophys. Res., 106, 25089-25102. Kim, T.K., et al., AIP Confer-ence Proc. 1500, pp. 140-146. Inner boundaries for ( )3D-MHD. Inner boundaries for MS-FLUKSS 3D-MHD ( ). Comparison of the 3D-MHD results with WIND data. Comparisons of the 3D-MHDsimulation results using time-dependent IPS boundaries with the OMNI data and UCSD kinematic solutions. Boundary at 0.25 AU. 7. Summary • The IPS 3D IPS reconstruction models are currently available and being run at several world locations. • The IPS time-dependent model is run in near-real time daily at UCSD, the CCMC, and the KSWC as the data • become available from STELab, Japan, for use in space-weather forecasting and for checking the 3D analysis. • Many ongoing projects currently underway intend to validate or enhance these 3D analyses. • These include: a) Comparison at the locations in the inner heliosphere where spacecraft measure plasma parameters, b) Inclusion of other data sources besides those from STELab to provide greater coverage in time, c) Production of Faraday rotation-measure sky maps using transient densities and background magnetic fields, d) Production of a time-dependent density and velocity inner boundary for use in 3D-MHD solar wind modeling.