Download
1 / 19
190 likes | 361 Views
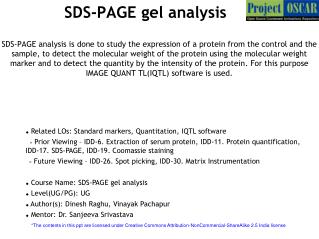
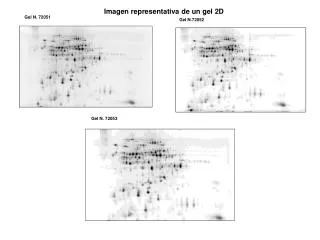
Harini Chandra. 2-DE gel analysis. a. Following 2-D gel electrophoresis, the gels are scanned using a suitable scanner and the images obtained are analyzed by means of various available softwares. These allow interpretation of data present in the form of spots on the gel images. Master Layout.

E N D
Harini Chandra 2-DE gel analysis a Following 2-D gel electrophoresis, the gels are scanned using a suitable scanner and the images obtained are analyzed by means of various available softwares. These allow interpretation of data present in the form of spots on the gel images.
Master Layout 1 Zoom tool 3-D graphical representation 2-D gel analysis software Spot analysis Image overlaying File Edit Tools View Reports Crop tool 2 Gel1 - Control Gel2 - Treatment Gel1 Gel2 3 4 5
Definitions of the components: 1 1. 2-D gel analysis software: Following 2-D electrophoresis, the gels obtained are scanned using a suitable scanner and the images are then analyzed using various software packages. These softwares enable spot identification, comparison of gels, overlaying of images, cropping the gels as well as computation of more advanced statistical parameters. These help in interpreting the gel images obtained. 2. Crop tool: This tool allows a specific defined region of the gel to be cut out from the entire gel. This helps in selection of regions that have high spot density for further analysis. 3. Zoom tool: The zoom tool enables a specific area or spot of the gel to be zoomed into for further careful examination and analysis. 4. Image overlaying: In order to be able to effectively compare the spot patterns on two different gels, overlaying of the two separate images is possible. The two gels are overlaid such that they appear as a single merged image. Spots that coincide lie on top of each other while others retain their original position on the gel. 5. 3-D graphical representation: Spot patterns obtained can be plotted as three dimensional graphs which are indicative of their intensity. Either the entire gel can be represented as a 3-D graph or a certain region can be selected for representation. 6. Spot analysis: It is possible to obtain physical as well as statistical parameters for each of the spots on the gels. This allows gels to be easily compared on a spot-by-spot basis thereby facilitating the process of analysis. 2 3 4 5
Step 1: Loading a gel image 1 File Edit Tools View Reports New Load Save Save as… Print Exit Gel 1 Gel 2 Gel 3 Gel1 - Control Gel2 - Treatment 2 3 4 Action Audio Narration Description of the action It is possible to load either a single or multiple gel images simultaneously. This is done by means of the ‘load’ option in the file menu. The saved gel images must be chosen, which are then displayed on the software. First sow the entire software features zooming in. Mouse pointer must click on ‘file’, then move to ‘load’ and click on ‘gel1 ‘ and then ‘gel2’ respectively. When gel1 is clicked, the image on left should appear and when ‘gel2’ is clicked, image on the right must appear. As shown in the animation. 5
Step 2: Image cropping 1 File Edit Tools View Reports Report Crop gels Detect spots Match gels Gel1 - Control Gel2 - Treatment 2 3 4 Action Audio Narration Description of the action Several tools are available for analysis of the gels. It is possible to crop the gels by selecting a specific region that is to be studied and then selecting the ‘crop gels’ function. Cropping gels helps in selection of regions with high spot density or in trimming of regions with high background staining but no spots. Mouse pointer must click on the second image tab having the rectangle on it. The dotted rectangles on the gel images must appear. Pointer must then click on ‘edit’ followed by ‘crop gels’ and the figures below must appear. As shown in the animation. 5
Step 3: Zooming into a selected region 1 File Edit Tools View Reports Gel1 - Control Gel2 - Treatment 2 3 4 Action Audio Narration Description of the action Specific, selected regions of the gel can be zoomed into for viewing the spots more closely and for comparison of spots between two gels. This is particularly useful for gels having large number of spots. Mouse pointer must first click on the second picture tab. The dotted rectangles must then appear. It must then move to the next tab with magnifying glass and click on that. When this happens, the boxed region must be zoomed into to show images below. As shown in the animation. 5
Step 4: Image overlaying 1 File Edit Tools View Reports Gel1 - Control Gel2 - Treatment 2 Control + Treatment 3 4 Action Audio Narration Description of the action Overlaying of images is a particularly useful tool for comparison of two gels. The gels are overlaid such that they appear merged and spots that coincide will overlap with each other. This is extremely helpful while comparing clinical samples of control and treatment, providing clear indication of the proteins that are differentially expressed. Mouse pointer must click on the last picture tab having the two overlapping rectangles. When this happens, the two gels must merge into one another to give the gel image in the centre as shown. As shown in the animation. 5
Step 5: Graphical representation 1 File Edit Tools View Reports Gel1 - Control Gel2 - Treatment 2 3 4 Action Audio Narration Description of the action The spots on the gels can be displayed as three dimensional graph. Either the entire gel can be chosen or a particular region can be selected for this representation. The peaks obtained in the graphical representation are directly related to the spot intensity. Mouse pointer must click on the fifth picture icon containing the graph. When this happens, the two graphical representations below must appear. As shown in the animation. 5
Step 6: Spot analysis 1 File Edit Tools View Reports Report Crop gels Detect spots Match gels Gel1 - Control Gel2 - Treatment 8 8 1 1 2 4 5 6 2 2 6 9 4 9 5 7 3 3 7 10 3 9 Parameters Smooth Saliency Min Area Auto Preview Detect Spots 60 4 Preview Cancel OK 4 Action Audio Narration Description of the action Every spot on the gel can be detected by selecting the ‘detect spots’ option. Parameters such as ‘smoothness’, ‘saliency’ and ‘min area’ must be suitably adjusted for maximum clarity. Once this is done, each spot will either be encircled or marked with a cross, depending on the settings, along with the spot numbers. Mouse pointer must click on ‘edit’ followed by ‘detect spots’. The popup box shown in the centre must appear. Mouse pointer must drag the slider bars as shown to the required values and then click on ‘OK’. When this is done, the red crosses and numbers on the spots must appear. As shown in the animation. 5
Step 6: Gel matching 1 File Edit Tools View Reports Report Crop gels Detect spots Match gels Gel1 - Control Gel2 - Treatment 8 8 1 1 2 4 5 6 2 2 6 9 4 9 5 7 3 3 7 10 3 Gel matching in progress…. Gel Matching Matching gels is complete! 9 matches have been created to 1 gel Gel Matching 4 Action Audio Narration Description of the action The software facilitates interpretation of the gel images by matching two different gel images obtained. The matching spots are marked and any variations in the spot position are indicated by blue lines in one of the gels. This provides an understanding about the reproducibility across gels. Mouse pointer must click on ‘edit’ and then ‘match gels’. The popup must appear saying ‘matching in progress’ followed by the next popup saying ‘matching is complete’. When this happens, the red crosses & numbers must appear along with the blue lines shown in ‘gel2’ image. As shown in the animation. 5
Step 7: Spot table 1 File Edit Tools View Reports 2 3 4 Action Audio Narration Description of the action Information regarding the various physical parameters of each spot can be obtained via the spot table. This table provides the spot number, intensity, area and volume of spots as well as the saliency of spots. These parameters help in judging the quality of a gel. Mouse pointer must click on the sixth pictorial icon showing the table. When this happens, the table must appear. As shown in the animation. 5
Step 8: Statistical gel analysis 1 Measure of relative variability of spots in a match, after accounting for magnitude of data values. Measure of the variability of sample data around their centre value. File Edit Tools View Reports Gives the general location of a variable and is calculated by arithmetic mean, median or midrange. Ratio of the maximum value to minimum value in the sample data specified. Gel analysis Statistics Spot comparison Scatter plots Histogram 2 3 4 Action Audio Narration Description of the action In addition to physical parameters, several statistical parameters can also be computed for each spot on the gel such as central tendency, mean, median, dispersion, coefficient of variation, standard deviation etc. Scatter plots and histograms can also be plotted for clear data analysis. These provide information regarding intra and inter-gel variations. Mouse pointer must click on ‘reports’ followed by ‘gel analysis’. The table must appear followed by each of the parameters getting highlighted sequentially along with its callout providing the meaning. Next, mouse pointer must click on ‘reports’ and then ‘scatter plot’. This plot shown must popup when this is done. As shown in the animation. 5
Step 9: Spot comparison 1 File Edit Tools View Reports Gel analysis Statistics Spot comparison Scatter plots Histogram pI 7 3 MW (kD) Gel1 - Control 2 80 MW markers 40 5 20 3 pI 3 7 MW (kD) Gel2 - Treatment 80 5 40 4 20 Action Audio Narration Description of the action It is also possible to specifically compare a particular selected spot across gels. When the gel is run with molecular weight markers, the weight of unknown proteins can be estimated from these. It is also possible to estimate the pI of the proteins. These parameters, in addition to other physical & statistical parameters, can be obtained for each spot. Mouse pointer must first click on the second pictorial tab. The dotted black rectangles and the number must appear. Next the mouse must click on ’reports’ and ‘spot comparison’. When this happens, the table on the right must appear. As shown in the animation. 5
Step 10: DIGE analysis 1 File Edit Tools View Reports Report Crop gels Detect spots Match gels Gel1 – Control – Cy3 labeled 8 8 1 8 5 1 1 2 4 4 6 6 6 2 2 2 9 9 9 4 5 5 3 3 Gel3 – Internal standard – Cy2 labeled 3 7 7 7 3 Enter no. of spots to be detected Detect Spots 9 Gel2 – Treatment – Cy5 labeled 4 Action Audio Narration Description of the action Software for DIGE analysis varies with respect to certain features compared to normal 2-DE analysis. It can compare three gels simultaneously, of which one is typically the pooled internal standard containing all spots. Any changes implemented in one gel such as cropping, spot selection etc. will be implemented across all three gels in DIGE. Mouse pointer must click on ‘edit’ and then ‘detect spots’. The popup box shown must appear where the number 9 must be typed as shown. This is followed by appearance of the pink crosses along with the numbers in all the three gels. As shown in the animation. 5
Step 11: DIGE analysis 1 File Edit Tools View Reports Gel1 – Control – Cy3 labeled Other analysis tools for DIGE are the same as those used for regular 2-DE analysis as depicted in the earlier animations. 8 8 1 8 5 1 1 2 4 4 6 6 6 2 2 2 9 9 9 4 5 5 3 3 3 7 7 Gel3 – Internal standard – Cy2 labeled 7 3 Gel2 – Treatment – Cy5 labeled 4 Action Audio Narration Description of the action Other features and tools for DIGE analysis are same as those used for 2-DE analysis. Physical and statistical parameters of all spots on the gels can be determined through their corresponding reports. Three dimensional graphical representation provides information regarding intensity of spots on the gel. The five pictorial tabs shown must be highlighted and must then grow in size as shown in animation, after which the text on the right must appear. As shown in the animation. 5
Interactivity option 1:Step No: 1 (a) 1 Find the number of matched spots in the gel below by performing the required steps in the software. File Edit Tools View Reports Report Crop gels Detect spots Match gels 2 Gel1 - Control Gel2 - Treatment 3 Gel matching in progress…. Gel Matching Matching gels is complete! 21 matches have been created to 1 gel Gel Matching 16 16 1 1 4 22 22 10 10 17 17 6 6 2 2 11 11 23 23 18 18 7 7 12 12 3 3 13 13 8 8 19 19 24 24 4 4 20 20 9 9 5 14 14 5 5 25 25 15 15 21 21
Interactivity option 1:Step No: 1 (b) 1 Find the number of matched spots in the gel below by performing the required steps in the software. A) 23 2 B) 21 C) 25 3 D) 24 4 Results Interacativity Type Options User must be allowed to perform the required steps in the software layout shown in the previous slide. The edit tab must be active for user to click on followed by the ‘match gels’ option. Once the user has clicked on these, the animation must appear as depicted. Once the ‘matching gel is complete’ appears, the question above must be displayed & user must be allowed to choose 1 option. The correct answer is (B). If user chooses this, then it must turn green. If user chooses any of the other options, they must turn red. 5 Clicking on tabs & Choose the correct answer.
Questionnaire 1 1. Which of the following tools helps in trimming unwanted regions of the gel? Answers: a) Zoom b) Match c) Crop d) Overlay 2. Gel A has 20 spots and Gel B has 18 spots, of which 10 are common to both gels. The total number of spots in the overlaid image would have: Answers: a) 38 spots b) 18 spots c) 30 spots d) 28 spots 3. Which of the following is NOT a statistical parameter? Answers: a) Spot intensity b) Dispersion c) Coefficient of variation d) Median • Which of the following is not a dye used in DIGE analysis? Answers: a) Cy-3 b) Coomassie bluec) Cy5d) Cy2 2 3 4 5
Links for further reading Links: • www.gelifesciences.com[ImageMaster] • http://www.genebio.com/products/melanie/