Download
1 / 60
620 likes | 807 Views
Time-series modeling in ecology: a synoptic overview. Nils Chr. Stenseth. Centre for Ecological and Evolutionary Synthesis. Outline. Matematisk Institutt, Oslo (05.04.05).

E N D
Time-series modeling in ecology: a synoptic overview Nils Chr. Stenseth Centre for Ecological and Evolutionary Synthesis
Outline Matematisk Institutt, Oslo (05.04.05) • The British Ecologist, Charles Elton – the first ecologist to appreciate the importance of long-term monitoring ecological data. • The Canadian lynx. • Vole, mice and lemmings. • The Soay sheep off the coast of Scotland. • Statistical modeling of long-term monitoring data. • A French-Norwegian data bank for ecological data
Elton: a zoologist – and the founding father of (modern) ecology • Lemmings – the Norwegian lemming – and long-term data on abundance of lemmings – played a key role in his intellectual development • Julian Huxley invited him as a field assistant to Spitsbergen/Svalbard in 1921 – the first of several expeditions “… I did go, and the experience had a profound influence upon my ideas in ecology …” • While returning from Spitzbergen in September 1923: Spitzbergen “I bought a book in a Tromsø shop that changed my whole life. It was bought with one of the three pounds I had left in my pocket – Robert Collett’s ‘Norges Pattedyr’ (=Norwegian Mammals) .. it was the part about lemmings that enthralled me”. Tromsø Oxford
Lemming and vole cycles lemmings In the Bible: “..swarms of grasshoppers sweeping over the country ..” 14th century A frustratingly distinct pattern with an ennoyingly elusive explanation Begon, 1998 From Olaus Magnus (1555) A Description of the Northern Peoples
But much story telling and myths around the lemmings and the lemming/vole cycles - raining from the sky - returning to Atlantis: a debate between Crotch and Collett in the pages of Nature in 1876 - Walt Disney in Barrow [Biology today (1971)] - Donald Duck in the Norwegian fjords. The Norwegian fiords are well known Donald Duck is well known But few know that he has watched lemmings running down the from the Norwegian mountains into the Norwegian fjords
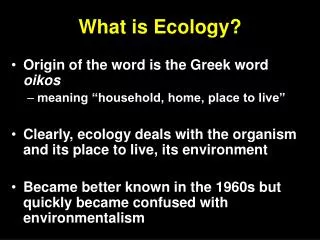
Elton contributed to make ecology quantitative at the Bureau of Animal Population A definition of ecology: “Ecology is the scientific endeavor aiming at explaining the distribution and abundance – and their changes thereof – of species in space through time by studying the environment of individuals in natural populations” (after CJ Krebs) That is, a quantitative definition of ecology “George” (PH) Leslie: The Leslie population matrix and Capture-Mark-Recapture modelling (e.g., Caswell 2003)
Lynx time series 1920-1994 1820-1940 Stenseth et al., Proc. Natl. Acad. Sci. 1998
Snowshoe hare and lynx are highly interconnected – but can we (through a second order autoregressive model) considerer only one of the species – and believe that we’ve gotten a “full” understanding of the dynamic interaction in the system?
… a second order delay equation in the variable we have data on (typically the lynx)
Fur returns are good proxies for actual abundance Stenseth et al., Proc. Natl. Acad. Sci. 1998
Predator-prey model with phase-dependence is equivalent to yt = (ai,0bi,2 + ai,1bi,0) + (2 - ai,1 - bi,1)yt-1 + (ai,1 + bi,1 - ai,1bi,1 - ai,2bi,2 - 1)yt-2 + et non-linear Phase dependency: threshold model Lower Upper b2,2 yt-2 b1,2 yt-2 yt-2 yt-2 Hares: Ht+1= Htexp[ai,0 - ai,1xt - ai,2yt] Predators: Pt+1= Ptexp[bi,0 - bi,1yt - bi,2xt] Stenseth et al., Proc. Natl. Acad. Sci. 1998
Phase-dependence Rochester, Alberta Kluane Lake, Yukon Functional response Phase dependency Stenseth et al., Proc. Natl. Acad. Sci. 1998
Let us ask the lynx (or the data on the lynx)... Is there any spatial structuring of these time-series data?
What is the spatial structuring force(s)? Stenseth et al., Science 1999
Canada divided by climatic regions Stenseth et al., Science 1999
The North Atlantic Oscillation (NAO)the difference in atmospheric pressure between the Azores and Iceland Iceland the Azores
The North Atlantic Oscillation (NAO)negative and positive phases low NAO high NAO NAO index 1860-2000
Climaticzonation Stenseth et al., Science 1999
This grouping was a result of statistical modeling Stenseth et al., Science 1999
What is the underlying causes of the geographic structuring? Stenseth et al., Science 1999
Difference in frequency of winter warm spells between opposite polarity of the NAO ‘X’ = locations (stations) that exhibit statistical significance at the 5% level Snow is a key factor for the trophic interaction between hare and lynx Stenseth et al., Proc. Natl. Acad. Sci. (2004)
… the snow condition may be a key factor in structuring the dynamic interaction between the hare and the lynx Source: Rudolfo's Usenet Animal Pictures Gallery
A synoptic account of the legacy of Elton’s work on the cycle problem – particularly on voles, mice and lemmings Population studies on voles, mice and lemmings
A way to summarize small rodent dynamics: 2-year ’cycles’ Stable Delayed annual density dependence (a2) 2.0 3.0 6.0 5.0 4.0 Proper multiannual cycles Direct annual density dependence (a1) Population dynamics: cycles and non-cycles xt = a1xt-1 + a2xt-2 + et
Cycles & Non-Cycles: a synoptic account (after Stenseth 1999, Oikos)
The Fennoscandian gradient Bjørnstad et al. PRSB, 1996. Stenseth et al. PRSB, 1996.
A continental European gradient Tkadlec & Stenseth PRSB, 1996.
Grey-sided voles in Hokkaido Stenseth et al.PRSB, 1996; Stenseth et al. Res Pop Ecol, 1998. Stenseth & Saitoh Pop Ecol, 1998. Stenseth et al. PRSB, 2002; Stenseth et al. PNAS 2003.
Grey-sided voles in Hokkaidoand seasonal forcing • the density dependent structure differ between seasons • the variation in density dependences among sites is – it seems – fully accounted for by the length of the seasons • long winters tend to generate cycles Stenseth et al.Res Pop Ecol, 1998. Stenseth et al. PRSB, 1999.
Vole, Mice and Lemmings: some conclusions • Populations within a given species might be both cyclic and non-cyclic. • Typically there are geographic gradients in the periodic structure. • Statistical work lead us to understand that the relative length of the seasons might determine whether cycles or non-cycles occur.
Modelling the effect(s) of climate fluctuations on population dynamics …some theoretical background
Single-species dynamics low b high b
(ii) Density dependence and climate, non-interactive (additive) effects Climt Xt Xt+1 = Xt·R(Xt, Climt) xt+1 = a0 + (1 + a1)·xt + g(Climt) + t+1 Additive effect of climate (iii) Density dependence and climate, interactive effects Xt Xt+1 = Xt·R(Xt, Climt) xt+1 = a0 + [1 + a1(Climt)]·xt + t+1 Climate affecting strength of DD Climt Single-species dynamics How to incorporate climatic variability in population dynamic models:- additively… …or non-additively
Maynard-Smith – Slatkin model t b Nt = Nt-1(R0/1+(Nt-1/K)bt Statistical model a1 e1,t a0 + a1(xt-1 - k) + e1,t if xt-1 k a0 + a2(xt-1 - k) + e2,t if xt-1 > k xt = e2,t a2 …generalized statistical model (iii) Density dependence and climate, interactive effects Xt Xt+1 = Xt·R(Xt, Climt) xt+1 = a0 + [1 + a1(Climt)]·xt + t+1 Climate affecting strength of DD Climt Mathematical and statistical modeling Much statistical work needs to be done – and is been done
Nt R Nt+1 = 1+(aNt )b(NAO) Single-species dynamics with climate effect (here: NAO) exp(κ) • Non-additive effect of climate • Non-linear intrinsic and extrinsic processes Using a piecewise linear model (FCTAR) for estimating parameters and functions
Nt R Nt+1 = 1+(aNt )b(NAO) Single-species dynamics: possible effects of changing climate b(NAO)
An example: the soay sheep off the coast of Scotland- one single species
Soay sheep at Hirta, St Kilda 2500 2000 1500 Number of individuals 1000 500 0 1955 1965 1975 1985 1995 Year 6 4 2 0 NAO -2 -4 -6 1955 1965 1975 1985 1995 The effect of climatic fluctuation on population dynamics
ResultsSoay sheep: dynamics depend on NAO Using a FCTAR non-linear and non-additive model Stenseth et al. (2004)
Soay sheep: dynamics depend on NAO Nt R Nt+1 = 1+(aNt )b(NAO) Low NAO High NAO