Download
1 / 14
140 likes | 309 Views
Sulkowski MS, Shiffman ML, Afdhal N, Reddy R, McCone J, Lee WM, Herrine SK, Harrison S, Deng W, Brass CA, Koury K, Noviello S, Albrecht JK, McHutchison JG on behalf of the IDEAL Study Team EASL 2009 Copenhagen, Denmark April 25, 2009. 1.

E N D
Sulkowski MS, Shiffman ML, Afdhal N, Reddy R, McCone J, Lee WM, Herrine SK, Harrison S, Deng W, Brass CA, Koury K, Noviello S, Albrecht JK, McHutchison JG on behalf of the IDEAL Study Team EASL 2009 Copenhagen, DenmarkApril 25, 2009 1 Hemoglobin Decline Associated with SVR Among HCV G1-Infected Persons: Analysis from the IDEAL Study
Background and Study Design Treatment-Related Anemia (30% of patients) Hemolysis (RBV) and bone marrow suppression (PegIFN) RBV dose reductions and treatment discontinuations Erythropoietin (EPO) supplementation Maintains RBV dose levels and improves patient quality of life Study objectives To test the hypothesis that treatment related hemoglobin decline are associated with virologic response during treatment with peginterferon and ribavirin therapy To assess the relationship of anemia, epoetin alfa use and virologic response during treatment with peginterferon and ribavirin 2
Study Schema and Treatment Regimens 3 N = 1019 PEG-IFN alfa-2b1.5 μg/kg/wk + RBV 800-1400 mg/d×48 weeks Follow-up24 weeks N = 1016PEG-IFN alfa-2b 1.0 μg/kg/wk + RBV 800-1400 mg/d ×48 weeks Screening Follow-up24 weeks N = 1035 PEG-IFN alfa-2a 180 μg/wk + RBV 1000-1200 mg/d ×48 weeks Follow-up24 weeks HCV RNAa 2 4 12 24 48 4 12 24 • Stratified by baseline viral load (> or ≤ 600,000 IU/mL) and race (African American) • Standard response stop criteria applied at weeks 12 (no EVR) and 24 (HCV RNA-positive) a LLQ <27 IU/mL (COBAS TaqMan; Roche)
Anemia and EPO Use 4 • Anemia • Protocol defined as Hb level <10 g/dL • RBV dose reductions • PEG-IFN alfa-2b + RBV arms • Full dose 800-1200 mg decrease by 200 mg (first dose reduction) then by 200 mg (second dose reduction) • Full dose 1400 mg decrease by 400 mg (first dose reduction) then by 200 mg (second dose reduction) • PEG-IFN alfa-2a + RBV arm • Full dose 1000-1200 mg decrease to 600 mg (product insert) • EPO use criteria • Permitted in patients with Hb level <10 g/dL with simultaneous RBV dose reduction • At the discretion of investigator and patient • Not provided by study
Subject Characteristics: Hgb Decline 5 a Using Cockcroft-Gault equation. Cr = creatinine.
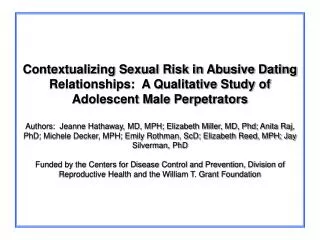
EOTa and SVRb Responses by Decline in Hb 7 Patients, % Hemoglobin Decline aEOT rates for >3 g/dL = 61.6% (1386/2250) and ≤3 g/dL = 41.8% (323/773); P < 0.0001. bSVR rates for >3 g/dL = 43.7% (984/2250) and ≤3 g/dL = 29.9% (231/773); P < 0.0001.
Subject Characteristics:Anemia/EPO 8 a Using Cockcroft-Gault equation. Cr = creatinine.
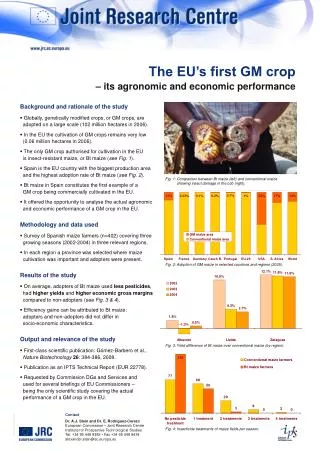
Median and Mean RBV Exposure (mg/kg/d) Higher in PEG-IFN alfa-2a Arm Than in alfa-2b Arms No Anemiaa Anemia/No EPOb Anemia/EPOc 25 Mean (SD) Mean (SD) Mean (SD) 12.6 (1.3) 11.5 (1.7) 11.7 (2.0) 12.8 (1.2) 11.8 (1.7) 11.8 (1.4) 13.4 (2.0) 12.6 (2.7) 12.5 (2.3) 20 15 Median RBV Exposure, mg/kg/d 10 5 0 PEG-IFN alfa-2b 1.5 + RBV PEG-IFN alfa-2b 1.0 + RBV PEG-IFN alfa-2a + RBV Treatment aP < .001 for PEG-IFN alfa-2b 1.5 + RBV vs PEG-IFN alfa-2a + RBV and for PEG-IFN alfa-2b 1.0 + RBV vs PEG-IFN alfa-2a + RBV; P = .012 for PEG-IFN alfa-2b 1.5 + RBV vs PEG-IFN alfa-2b 1.0 + RBV. bP < .001 for PEG-IFN alfa-2b 1.5 + RBV vs PEG-IFN alfa-2a + RBV; P = .002 for PEG-IFN alfa-2b 1.0 + RBV vs PEG-IFN alfa-2a + RBV; P = .270 PEG-IFN alfa-2b 1.5 + RBV vs PEG-IFN alfa-2b 1.0 + RBV. cP < .001 for PEG-IFN alfa-2b 1.5 + RBV vs PEG-IFN alfa-2a + RBV; P = .001 for PEG-IFN alfa-2b 1.0 + RBV vs PEG-IFN alfa-2a + RBV; P = .616 for PEG-IFN alfa-2b 1.5 + RBV vs PEG-IFN alfa-2b 1.0 + RBV.
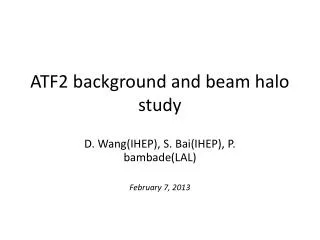
Early Anemia Treated with EPO Resulted in Higher SVR Rate* 10 *P<0.001 for early anemia (≤8 weeks of treatment).
Lower Discontinuation Rates in Early Anemia Treated with EPO 11
Odds Ratios for SVR (EPO vs No EPO) 12 aNo control for potentially confounding factors. bOdds ratio adjusted for all potentially confounding factors (age, gender, race, BMI, baseline viral load, fibrosis, steatosis, fasting glucose, ALT, hemoglobin, platelet count, ribavirin (mg/kg/day) assigned, genotype (1a, 1b), and body weight). cOdds ratio adjusted for factors related to outcome (stepwise variable selection procedure based on all anemic subjects: race, baseline viral load, fibrosis, steatosis, fasting glucose, and body weight).
Safety 13
Conclusions Higher magnitude of Hb decline is associated with higher likelihood of SVR EPO use was associated with higher SVR rates if anemia occurred in the first 8 weeks of treatment No benefit of EPO use in patients who became anemic after 8 weeks of treatment Magnitude of Hb decline may be a pharmacokinetic marker for efficacy of treatment and EPO may prevent treatment discontinuation in patients with early anemia 14