Download
1 / 19
200 likes | 330 Views
ATF2 background and beam halo study. D. Wang(IHEP), S. Bai (IHEP), P. bambade (LAL) February 7, 2013. Schematic of Shintake monitor. Design beam size at the ATF2 is 37 nm for vertical. So much small beam size has to be measured by Shintake monitor.

E N D
ATF2 background and beam halo study D. Wang(IHEP), S. Bai(IHEP), P. bambade(LAL) February 7, 2013
Schematic of Shintake monitor • Design beam size at the ATF2 is 37 nm for vertical. • So much small beam size has to be measured by Shintake monitor. • Inverse-Compton photons (signal) produced from the interaction of laser beam and electron beam will be detected by a Gamma detector downstream the IP.
Background in the Gamma detector • Background of the gamma detector decreases modulation depth and can be a systematic error of the modulation measurement. • Background sources [1]: Synchrotron radiation from final focusing magnets photon energy a few keV be stopped at the beam pipe and can not arrive at the gamma detector Beam-residual gas bremsstrahlung Beam halo scattering with beam pipe focus of our study
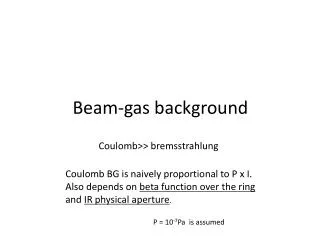
Estimation of beam-gas bremsstrahlung Assuming the N2 gas is dominate in ATF2, the relative energy loss due to beam-gas bremsstrahlung is 10-6 for minimum and 1 for maximum, respectively. Then the cross section of bremsstrahlung for each electron is [2] Residual gas density (n=2, P=510-7 Pa): (nthe number of atoms in each gas molecule, Pthe pressure of the gas) The critical section for the photon emission which can arrive at the gamma detector is between the two nearest bending magnet from IP (L12m) and the electron population per bunch is assumed Ne=11010 Photon number per bunch: << signal photons (103)
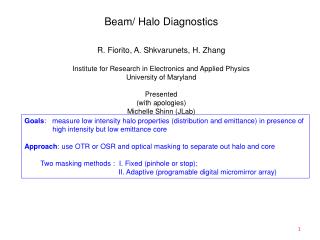
Halo measurement at old ATF extraction line • beam core (<3) is well approximated by a Gaussian. • Beam tail (<3) deviate from the center Gaussian-like distribution T. Suehara et al., “Design of a Nanometer Beam Size Monitor for ATF2”, arXiv:0810.5467v1
Charge distribution according to the absolute distance Circle-horizontal Square- vertical • Beam halo expansion is proportional to the central beam size • T. Suehara et al., “Design of a Nanometer Beam Size Monitor for ATF2”, arXiv:0810.5467v1
Charge distribution according to the center beam size Circle -horizontal Square- vertical • Charge distribution of the beam halo is power functional. • T. Suehara et al., “Design of a Nanometer Beam Size Monitor for ATF2”, arXiv:0810.5467v1
Halo distribution formula Assuming the charge distribution of beam tail is (Horizontal and vertical until 6) (Vertical outside 6) Center density The density at 4 = 1/500 of peak density Horizontal density at 6 = vertical density at 6
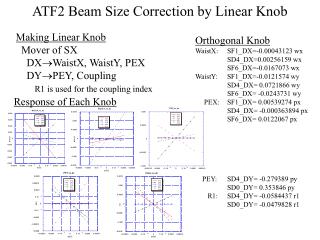
Simulation of halo loss on beam pipe Minimum aperture 7.28 x 31.8 y 1.9% loss 14% loss
Estimation of beam halo loss rate Total halo electrons: Halo loss rate before QF9BFF due to horizontal aperture: Halo loss rate before QD4AFF due to vertical aperture: • Beam halo is cut at QF9BFFby7.28 x and QD4AFFby31.8 y. • Simulation loss rate agree well with analytical estimation.
Background sources for gamma detector • The section for photon emission which can arrive at gamma detector is from the last bending magnet before final doublet to the bending magnet after IP. (79-91m) • There are two section where background can contribute to the gamma detector: 1) final doublet, 2)entrance of bending magnet after IP. • For final doublet section, the maximum number of the electrons in 7.28-17.28 x is estimated to be 2.5106. We can assume only small part of halo (5105) pass through QF9BFF and hit beam pipe at final doublet. • For BDUMP section, the vertical aperture at the middle of the bend is about 22.5 y. So the number of the electrons in 22.5-31.8 y is estimated to be 4.3 105.
SAD MAD We need to check the different aperture! MAD
Simulation difference in MAD and SAD • Halo initialization • BDUMP aperture setting
Halo distribution in ATF damping ring • In order to know the halo distribution especially the longitudinal distribution for position and energy spread at entrance of ATF2 , and also the relation between longitudinal tail and transverse tail, we need to study the halo and it’s mechanism on ATF ring. • Intrabeam scattering is a multiple Coulomb scattering with small momenta transfer and leads to a continuous increase of bunch or beam dimensions. • The beam core of the particle distribution is due to the multiple soft scattering with smaller momenta transfer, while the tails are due to the infrequent hard scattering with relatively larger momenta transfer and hence larger oscillation amplitude. • We hope to make some analytical estimations for beam tails. • Simulations with IBS may need tremendous CPU time or powerful computer??
Hint from halo simulation on the Pohang Light Source [5] (sigmaY) (sigmaX) • Single large angle scattering was simulated to produce the tail distribution. • Transverse distribution is dominated by IBS and beam gas elastic scattering, and energy distribution is dominated by beam gas bremsstrahlung. • IBS affects transverse tails more than beam gas scattering. • Vertical distribution is more affected than the horizontal distribution by the beam gas scattering because y/y>x/x (average x y). • Gaussian distribution up to 7 sigma of the energy spread in PLS. (Can this conclusion be applied on ATF??) (sigma)
conclusions There are two sources where beam size are large and background can contribute to the gamma detector: 1) final doublet (constraint by horizontal aperture) 2) entrance of bending magnet after IP (constraint by vertical aperture) The number of halo electrons assumed to produce background ( about 5105 from final doublet section and 4.3 105 from post-IP section) are much larger than the number of signal photons (103).—dominant background We made cross check of halo simulation in ATF2 by SAD based on halo measurement at the old ATF extraction line. The longitudinal distribution both in SAD and MAD simulations are not clear. The detail of halo generator program for simulation need to be check . We need further study of halo distribution on ATF ring either by theoretical method or by simulation as the input of ATF2.
references [1] T. Suehara et al., “Design of a Nanometer Beam Size Monitor for ATF2”, arXiv:0810.5467v1 [2] A. Chao et al., Handbook of Accelerator Physics and Engineering, p.258, World Scientific (1999). [3] S. Bai, Post Doc thesis (in Chinese). [4] K. Oide, SAD program, http://acc-physics.kek.jp/SAD/SADHelp.html [5] Eun-San Kim, “Estimates of the non-Gaussian Beam-Tail Distributions and the Beam Lifetime at the Pohang Light Source”, Journal of the Korean Physical Society, Vol. 44, No. 4, April 2004.