Download
1 / 4
40 likes | 42 Views
A comparison of the total number of Work Authority and Work Plan applications in the regulatory system as of March 2018 and March 2019, broken down by new applications, lodged applications, and finalised applications.

E N D
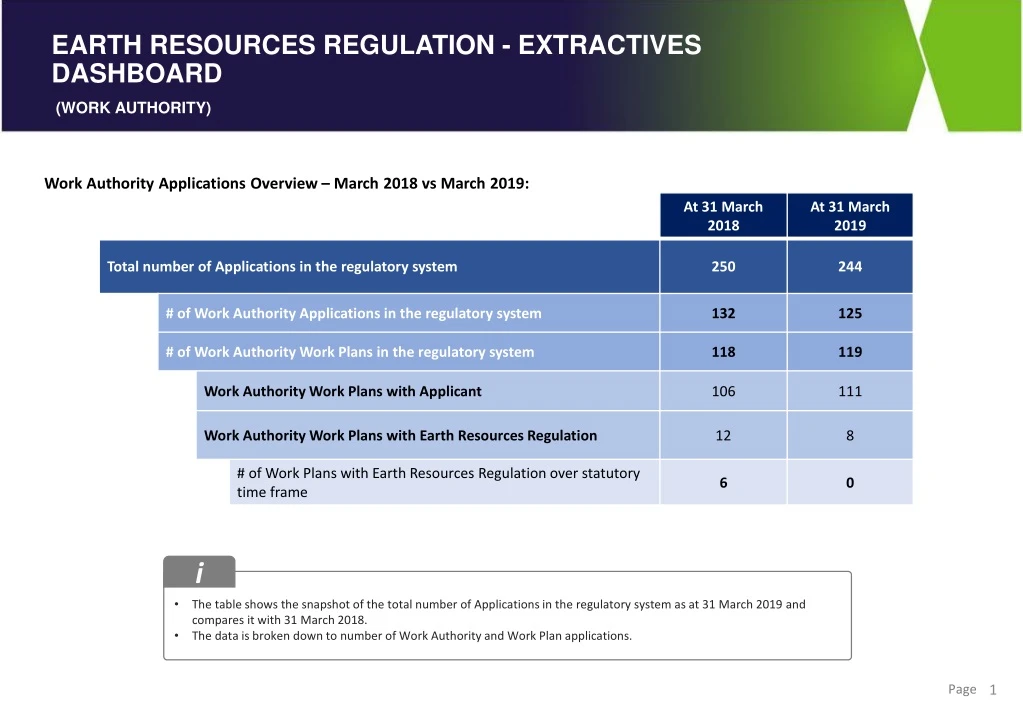
Work Authority Applications Overview – March 2018 vs March 2019: i • The table shows the snapshot of the total number of Applications in the regulatory system as at 31 March 2019 and compares it with 31 March 2018. • The data is broken down to number of Work Authority and Work Plan applications.
New Work Authorities and Work Plans Lodged and Finalised New Work Authority Lodged i • New Work Authorities lodged: • Shows the total number of Work Authority and Work Plans (WA) lodged over a 12 month period since April 2018 and the number of applications lodged in March 2019. • Work Authorities Finalised: • Shows the total number of Work Authority and Work Plans (WA) finalised over a 12 month period since April 2018 and those that were finalised in March 2019. Finalised work plans are those that were Approved, Refused or Withdrawn. • Rock Type: • This table shows the primary extractive resources for the Work Plans finalised in the period. Work Authority Finalised Rock type – Work Authority and Work Plans approved Apr 2018 to Mar2019 Legend A – Approved R - Refused W - Withdrawn
i • This graph shows the number of Work Plans (WA) in the regulatory system over the last 12 months. • Stacked bar graph - Shows the total number of Work Plans in the regulatory system. • Line Graphs – Shows the total number of Work Plans that were lodged / finalised for the calendar month.
Median Days for Work Authority work plan stages completed in April 2018 to March 2019 Work Plan stages in the below tables were from Work Plans where one or more stages were completed in the year Definitions: Median Days #: Arranging the stage duration in order and then selecting the one in the middle duration. Median is used to minimise the impact of outliers. No. Work Plans*: The number of work plans that had that stage assessed in the year. A single Work Plan may have had a stage assessed multiple times. Total Work Plans that had one or more stages assessed in the 12 months: 34 Statutory Endorsement Required Statutory Endorsement Not Required i • A work plan goes through various stages from New to Finalised. The tables identify the stages, the median days for each stage to be completed and the number of work plans that had the stage assessed from April 2018 to March 2019. Total Work Plans that had one or more stages assessed in the 12 month: 24