Download
1 / 27
310 likes | 703 Views
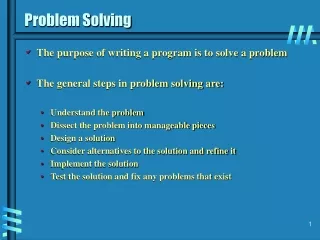
Problem Solving. Six-Step Problem-Solving Process. Step 1: Identify and Select the problem Step 2: Analyze the problem Step 3: Generate Potential Solutions Step 4: Select and Plan the Solution Step 5: Implement the Solution Step 6: Evaluate the Solution.

E N D
Six-Step Problem-Solving Process • Step 1: Identify and Select the problem • Step 2: Analyze the problem • Step 3: Generate Potential Solutions • Step 4: Select and Plan the Solution • Step 5: Implement the Solution • Step 6: Evaluate the Solution
Step 1: Identify and Select the problem • Question to ask: • What can you see that causes you to think there’s a problem? • Where is it happening? • When is it happening? • With whom is it happening? • Why is it happening?
Step 2: Analyze the problem • Look at potential causes for the problem. • QFD • Charts and Graphs • Root Cause Analysis (RCA) • Using the 5 Whys method • Fishbone diagram • Process control charts
Pareto Chart • What Questions The Pareto Chart Answers • What are the largest issues facing our team or business? • What 20% of sources are causing 80% of the problems (80/20 Rule)? • Where should we focus our efforts to achieve the greatest improvements? Identify Problems
Histogram Chart • Use if you want to determine which category of item, you focus your efforts on. Study current conditions – problem identification
5 Whys Method • Benefits • Help identify the root cause of a problem • Determine relationship between different root causes of a problem • One of the simplest tools; easy to complete without statistical analysis
Contrib . Cause Contrib . Cause Direct Event Cause Contrib . Root Cause Cause Cause Chain
How to complete the 5 Whys • Write down the specific problem. • Ask Why problem happens and write down the answer • If the answer doesn’t identify root cause then repeat. • Keep repeating until team is in agreement that problem’s root cause is identified.
Fishbone Diagram • One way to capture these different ideas and stimulate the team's brainstorming on root causes • helps to visually display the many potential causes for a specific problem or effect. • It is particularly useful in a group setting and for situations in which little quantitative data is available for analysis. • Another benefit • We like to get right to determining what to do about a problem, this can help bring out a more thorough exploration of the issues behind the problem - which will lead to a more robust solution.
Construction for Service Industries4 Ps Infers causes
Statistical Process Control • Methodology for monitoring a process which can identify special causes of variation and take corrective action when appropriate. Standardize improvements
SPC Metrics • Attribute - performance characteristic that is either present or not • Mistakes per week • Number of complaints • Variable – degree of conformance to specifications • Time waiting for service
Control Chart • Simply a run chart with an upper horizontal line called upper control limit and lower horizontal line called lower control limit • In a control chart, control limits are calculated by the following formula: • (Average Process Value) (3 x (Standard Deviation))
Standard Deviation • 1 σ away from mean in either direction accounts for approx. 68% of readings in the group (red area) • 2 σ away from mean in either direction accounts for approx. 95% of readings in the group (red and green area) • 3 σ away from mean in either direction accounts for approx. 99% of readings in the group (red, green, and blue areas)
Constructing Run Charts • Draw and label the vertical (y) axis using the measurement units you are tracking (e.g., numbers of defectives, mean diameter, number of graduates, percent defective, etc.) • Draw and label the horizontal (x) axis to reflect the sequence in which the data points are collected (e.g., week 1, week 2, ... or 8AM, 9AM, 10AM, etc.) • Plot the data points on the chart in the order in which they became available and connect the points with lines between them.
Constructing Run Charts • Calculate the average from the data, and draw a horizontal line across the chart at the level of the average. • Interpret the chart and decide what action to take. Are trends present? Would the chart look different if everything were perfect? The key is to look for trends, and not focus on individual points.
3. Brainstorm for solutions to the problem. • Appoint facilitator/recorder • Allow the group a few minutes to record first thoughts silently • Go around one at a time record each idea/phase. “PASS” if nothing comes to mind. • Classify ideas then pick 4-5 top ideas. • Discuss the ideas and come to consensus
4. Select an approach to resolve the problem and . . . • Which approach is most likely to solve problem long term? • Which approach is the most realistic to accomplish for now? Do have the resources? Are they affordable? Do you have enough time to implement the approach? • Prioritize the solutions into what would work the best.
Plan your action plan • What are the steps to implement the best alternative? • Don’t resort to solutions where someone is “just going to try harder”. • Write a schedule that includes start and stop time, and when do you expect to see certain successes. • Who will primarily be responsible.
5. Implement plan • Are you seeing what you would expect? • Will the plan be done according to schedule? • If the plan is not being followed, should it be changed?
6. Evaluate the solution • Measure results.