Download
1 / 53
530 likes | 638 Views
KX-NCV200 ( Production Version 1.00 ). Panasonic Communications Co., Ltd. Office Network Company Edition 1.2 9 Mar., 2007. 1.1 What is NCV200 1.1 System Block Configuration 1.2 Comparison Table 1.3 Connection Diagram 1.4 Product Structure 1.5 System Requirements

E N D
KX-NCV200 (Production Version 1.00) Panasonic Communications Co., Ltd. Office Network Company Edition 1.2 9 Mar., 2007
1.1 What is NCV200 1.1 System Block Configuration 1.2 Comparison Table 1.3 Connection Diagram 1.4 Product Structure 1.5 System Requirements 2. Features 2.1 ACD Monitor 2.2 Performance Graphs 2.3 ACD Reports 2.4 Call Log 2.5 Agent Log 3. How to install NCV200 3.1 PBX Setting 3.2 NCV200 Setting 3.3 ACD Report Client Setting 4. Additional Information KX-NCV200
1. What is NCV200 (1/1) KX-NCV200 has two main features.(1) ACD Report Server(2) Voice Processing System ACD Report Server is an end user management tool. - Real-time Status Monitoring for All TDA Agents - Real-time Performance Analysis - Powerful Report / Monitor / Graphs - Agent ID Based Management -> So, you can monitor the ICD-Groups and make reports of each Agent ID. Moreover, you can operate the ACD Report System without requiring a server PC.
1.1 System Block Configuration (1/1) DSP DPT I/F DSP DSP DPT I/F DSP ACD Report Server (KX-NCV200) CPU BOARD 4-port DPT Expansion Card LINE UNIT DSP UNIT VPS Application ACD Report Server ACD Report Client PC Database ACD Report Client Application VPS functions Linux(OS) Database (mdb format) Line×6 USB2.0 CSTA LAN
1.2 Comparison Table (1/1) Note : Reports can be exported in .pdf, .html or .rtf (Rich Text) format. .csv report output format is not supported.
1.3 System Connection Diagram (1/2) P a P a n n a a s s o o n n i c i c (1)Processing when system starts up. KX-NCV200 (ACD Report Server + VPS) • 2. ACD Report • Server requires • PBX to send data. 4. ACD Report Server sends data to ACD Report Client. LAN 1. ACD Report Client requires ACD Report Server to send data. 3. PBX sends the required data to ACD Report Server. Telephone Company 5. Reports are made and the state is displayed. PBX(KX-TDA100,200,600) Agent-C ACD Report Client PC Login/logout request Agent-B Agent-A
1.3 System Connection Diagram (2/2) (2)Processing when incoming call arrives. Incoming Call KX-NCV200 ACD Report Server Database for - Call Log - Agent Activity Built-in ACD CTI I/F Card Client PC (Supervisor) CSTA Data ACD Report / Monitor Data LAN
1.4 Product Structure (1/6) (1)Main Unit (Model number : KX-NCV200) (2)Bundled applications (Distributed by CD-ROM)
1.4 Product Structure (2/6) • The system allows multiple ACD consoles to be loaded on client computers. However only 3 ACD consoles can run simultaneously. • All consoles can chose their style of charts and well as the information viewed. • Agent mode can be used in installs where users do not have specific desks or share desks for different shifts. Otherwise member information relates to ICD group members.
1.4 Product Structure (3/6) • The NCV200 connects to the KX-TDA100/200/600 via the CTI Link Card Only. • The CTI Link Card sends CSTA (call information) to the VM through the LAN Card. - You must set the IP address of the LAN Card in the ACD server software for communication. • The VM and ACD operate on different ports in the network. • Static IP addresses must be set on both the CTI Link Card and the VM LAN Card. • The ACD server IP Address must be set in the client software for current display information.
1.4 Product Structure (4/6) • The up-grade from TVM to NCV200 is not possible. • NCV200 and other CSTA applications cannot be used simultaneously. • NCV200 and PA cannot be used simultaneously. • It is not possible to control two PBX or more by NCV200. • NCV200 does not have the recording function. • "Time synchronous" is executed from TDA system to NCV200 at 3:05 AM every day. • It is not possible to monitor the virtual PS.
1.4 Product Structure (5/6) • NCV200 does not have the function of “Login/logout” and “Changing the client name” and “Changing the member of groups”. • NCV200 does not require the enhanced SD Card. But, if you use the Longest Idle function, it is necessary. • NCV200 has the function not “Hot desk” but “Hot Seating Function”. • NCV does not have the account calculation function.
1.4 Product Structure (6/6) • The using port number - Server : Default Listen port is 10001. - Client : Connection port on Client side is not fixed. This is changed every time you connect client to ACD Report Server.
1.5 System Requirements (1/1) (1)Supported PBX (2)The system conditions of ACD Report Client
2.1 ACD Monitor (1/7) • Free Layout Monitor Data Display • Real-time Monitoring Various Data in Agent, group, so on • Show Color indication for Alert status Depth of Monitoring Status: 1. Total 2. Queue 3. Group 4. Agent
2.1 ACD Monitor (2/7) (1) Monitoring Features To know current “informal Centre’s performance” One screen shows Two(2) important Real-time info. Managers can decide any quick or temporal changes to improve today’s or future performance by these real-time info. Real-time Active / Cumulative Counters • Real-time monitor the activity of each component through various Counters • Group Counters, Agent Counters and Timers Real-time Agent Status • Overview of Group and Agent Status logging-in to ACD Group • Real-time Agent Status Monitor (Idle, Busy..) Note :The monitor screen can be displayed on one page only.
2.1 ACD Monitor (3/7) (2) Monitoring Features – Agent Status • Easy to understand Agent Status with Explorer like Tree View. • Real-time Agent Status Monitor 1) Tree View / Structure (3 levels) ACD System ACD Group (e.g. Customer Centre, Sales …) Agent (e.g. Jones, Dennis, Kim …) 2) Visual Status Display – Agent (by Icon) IconStatus IconStatus : Ringing-Incoming Call with Caller ID : Talking-Incoming Call : Talking-Outgoing Call : Hold : Busy : Idle : Break, Out of Service : Wrap-up etc.
2.1 ACD Monitor (4/7) (3) Monitoring Features - Counters Many different Counters are displayed in same screen Available Counters Max. 9 Counters & Timers are available in Monitor screen at the same time. Examples of Group Counters Choose a Group in Tree View Overflowed Calls to other Group Lost Calls in Group Waiting ACD Calls (in Queue) in Group A B C A B Note : It is not possible to copy the counter of Agent in monitor screen to another Agent. C Supervisor can choose, decide and monitor …. • Type of Counters to show in a screen • No. of Counters in one screen
2.1 ACD Monitor (5/7) (4) Monitoring Features – Counters & Timers ACD Report Client has the counter individually, so clear counter does not affect to the other clients. a Examples of Agent Counters Choose an Agent in Tree View Total Incoming Calls to the Agent Examples of Agent Timers Busy Time and % Idle Time and % Break Time and % Wrap-up Time and % A A B C B D C E D E You can see the duration time in the Agent Counter in real time. Also, you can see it in the Call Log.
2.1 ACD Monitor (6/7) (5) Monitoring Features – Alert Function (1/2) Three (3) different Alarms give special Notice to Supervisor, when a certain Counter exceeds Threshold. For example, No. of Waiting Calls in a Group exceeded Threshold ….. 1) Colour of Character changes from original colour to Special colour (e.g. : from black to red) 2) Window Task Bar flashes w/Blue colour It is not possible to change the back color with the Alert function. 3) Alarm Sound comes out
The sound is selectable (any preferred wav file) 2.1 ACD Monitor (7/7) (5) Monitoring Features – Alert Function (2/2)
2.1.1 System Counters Active Counters Cumulative Counters Peak Counters Current Incoming Calls Total Incoming Calls Peak Incoming Calls Current ACD Calls Incoming ACD Calls Peak Incoming ACD Calls Current Incoming Non ACD Calls Incoming Non ACD Calls Peak Incoming Non ACD Calls Waiting Calls Total Answered Calls Peak Waiting ACD Calls Waiting ACD Calls Answered ACD Calls Peak Calls in Queue Waiting ACD Calls in Queue Answered Non ACD Calls Active Answered Calls Lost ACD Calls Current Outgoing Calls Total Abandoned System Calls Log In Agents Outgoing Calls Log Out Agents Lost ACD Calls(%) System Counters consist of the following items. The not answered calls are counted as Lost Call and Abundant Call. It is possible to count not only ACD incoming call but also direct incoming call to the extension. Waiting Calls = Waiting ACD Calls + Waiting Non ACD Calls Waiting Calls = Ringing Calls + Queuing Calls.
2.1.2 Queue Counters Queue Counters consist of the following items. Active Counters Cumulative Counters Peak Counters ACD Calls In Queue ACD Calls In Queue Peak ACD Calls In Queue Queued Calls to Overflow destination Lost ACD Queued Calls Abandoned Queued Calls
2.1.3 Group Counters Group Counters consist of the following items. Note : Longest Queue Waiting Time cannot be displayed in the ICD group monitor
2.1.4 Agent Counters (1/2) Agent Counters
2.1.5 Agent Counters (2/2) Cumulative Timers
2.2 Performance Graphs In Performance Graphs, you can see different real-time statistics and comparative graphs (custom or predefined) on Agents/Groups/System performance and status.
2.2.1 Predefined Performance Graph (1/2) Predefined Performance Graph provides the following type of graphs. (1)Horizontal Bar – Agents Status This graph will display in real-time the agents status using horizontal bars. (2)Vertical Bar – Evolution Agent This graph will display in real-time the evolution of one agent using vertical bar. (3)Vertical Bar Percentage Stacked – Instant Agents This graph will display in real-time for the selected agents the percentage of time for each status. (4)Vertical Bar Percentage Stacked – Evolution Item This graph will display in real-time the percentage of ACD Calls, Non ACD Calls, Outgoing calls and Lost calls for a selected item (System, group, agent or queue). Note : It is not possible to see the state of agent's HOLD Call with Performance Graph.
2.2.1 Predefined Performance Graph (2/2) (3)Vertical Bar Percentage Stacked - Instant Agents (1)Horizontal Bar – Agents Status (4)Vertical Bar Percentage Stacked - Evolution Item (2)Vertical Bar – Evolution Agent
2.2.2 Custom Performance Graph (1/1) Custom Performance Graph provides the following type of graphs. • Monitor Single Item • Monitor Multiple Items • Monitor Multiple Items [Multiple Counters]
The ACD Reports provides various call statistics for the requested time period. 2.3 ACD Reports 2.3.1 Trunk Call Report 2.3.2 System Report 2.3.3 Group Report 2.3.4 Agent Report 2.3.5 Agent ID based Report
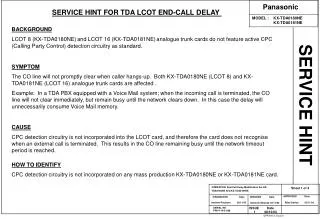
2.3.1 Trunk Call Report Trunk Call Report lists all calls monitored from either all trunks or a group of trunks identified by the same DDI/DID/MSN during a user selected time period (based on the information from Call Log – Trunk Based). The output format is as follows. - Reports ---> PDF and HTML - Call Log ---> CSV only
2.3.2 System Report System Report provides summary information accumulated on the user selected time period regarding all Agents activity; information is grouped according to the selected time division.
2.3.3 Group Report Group Report provides information accumulated on the user selected time period regarding all Agents activity for the user specified ACD Group(s). - Client can chose colors per agent as well as agent names.
2.3.4 Agent Report Agent Report provides information accumulated on the user selected time period for the user selected Agent of Agent(s).
2.3.5 Agent ID based Report Agent ID based Report allows you to exactly monitor each Agent activity; the ID number is unique for each Agent.
2.4 Call Log Displays call history based on CO Trunk or Agent data. You have two options here: Trunk Based – a list of call log information based on Customer data. Agent Based - a list of call log information based on the Agent data. The Lost calls are highlighted in red. Note: We can see detailed call information not only incoming call but also outgoing call.
2.5 Agent Log Report shows information for agents including - Log in - Log out - Break Time - Idle Time - Busy Time
3. How to install NCV200 3.1 PBX Setting 3.1.1 How to configure CTI_LINK Card 3.1.2 How to set the Dial Information feature number (Agent Mode only) 3.1.3 How to configure Incoming Call Distribution Group (ICD Group)
3.1.1 How to configure CTI_LINK Card You need to set up CTI_LINK card to connect to NCV200. (1) Insert CTI_LINK card to PBX (2) Open ‘Card Property’ of CTI_LINK card from 1. Configuration > 1. Slot of Maintenance Console. (3) Configure the settings such as IP Address on ‘Card Property’ window.
To run the system with NCV Agent mode, you need to set the Dial Information (CTI) feature number. 3.1.2 How to set the Dial Information feature number(Agent Mode only) (1)Open 2. System > 6. Numbering Plan > 1. Main > Features tab of Maintenance Console. (2)Input the appropriate number to Dial box of No.65 : Dial Information (CTI) and click on Apply button.
3.1.3 How to configure Incoming Call Distribution Group (ICD Group) You can configure ICD Groups as follows. (1)Configure ICD Group settings on 3. Group > 5. Incoming Call Distribution Group > 1. Group Settings of Maintenance Console. (2)To add member extensions, click on Member List button on the window of step1.
3.2 NCV200 Setting 3.2.1 How to configure LAN Card
In the KX-TVA/NCV Maintenance Console go to Utility – LAN settings and enter IP Address 3.2.1 How to configure LAN Card Setting
3.3 How to set up ACD Report Client 3.3.1 Install the client application 3.3.2 How to login to the system 3.3.3 Basic Settings 3.3.4 Configuration Settings 3.3.5 How to configure NCV200 in NCV Agent mode
3.3.1 Install the client application Double-click the ACD_Report_Server.exe on the installation CD to start the ACD Client Application installer application. Please refer to Installation Manual for details.
3.3.2 How to login to the system When you execute the client application, the following window appears. To login to the system, please input the correct password and click on OK button. When you would like to change the server information, please do it on Server Location window which you can open clicking on Server Location button on ACD Report Server Log-In window.
3.3.3 Basic Settings Basic Settings provides the following settings. • Date/Time format • Counters reset time • Abandoned Call Threshold Time • Database maintenance • E-mail setting
3.3.4 Configuration Settings Configuration Settings provides the following settings. • Display the current system status (e.g. Server connection state, • PBX connection state) • PBX Connection • Server connection port • System mode • Execute the server update • Data storage period • ON/OFF Debug logs The meaning of "Restart" processing makes to restart only the ACD Report Server functionality. It does not affect to VPS functionality. The maximum Size of "Server Debug Log" is 110MB.
3.3.5 How to configure NCV200 in NCV Agent mode When you choose NCV Agent mode in Agent Setting in Configuration Settings, you can configure the following settings. • Agent logout time • Agent Data in [System Data]-[Agent Data]