Download
1 / 16
160 likes | 299 Views
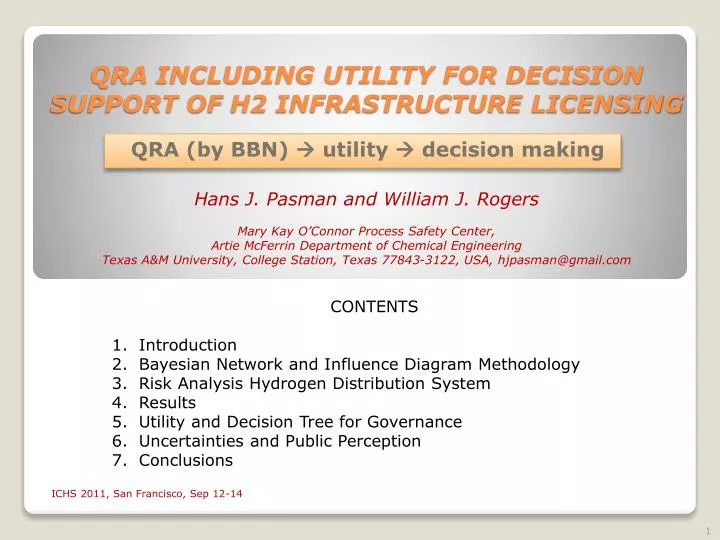
QRA INCLUDING UTILITY FOR DECISION SUPPORT OF H2 INFRASTRUCTURE LICENSING. Hans J. Pasman and William J. Rogers Mary Kay O’Connor Process Safety Center, Artie McFerrin Department of Chemical Engineering Texas A&M University, College Station, Texas 77843-3122, USA, hjpasman@gmail.com.

E N D
QRA INCLUDING UTILITY FOR DECISION SUPPORT OF H2 INFRASTRUCTURE LICENSING Hans J. Pasman and William J. Rogers Mary Kay O’Connor Process Safety Center, Artie McFerrin Department of Chemical Engineering Texas A&M University, College Station, Texas 77843-3122, USA, hjpasman@gmail.com QRA (by BBN) utility decision making CONTENTS Introduction Bayesian Network and Influence Diagram Methodology Risk Analysis Hydrogen Distribution System Results Utility and Decision Tree for Governance Uncertainties and Public Perception Conclusions ICHS 2011, San Francisco, Sep 12-14
QRA builds on scenarios; BBN consists of nodes connected by arcs; = acyclic digraph like FT, ET, bowtie, but more suitable to depict scenarios. Managements, public, authorities expect certainty when we are asked to predict safety risks. However, QRA is full of uncertainty; moreover software is bulky, not flexible and not transparent. Now are available discrete and continuous distribution BBN tools with operators, arithmetic, logical/conditional functions. Scenarios do not only branch, but also pinch! There are events leading to the same follow-on event: (cascading, escalating,coincidental events merging). There are time influences, human interventions, conditions of various kinds Why QRA with BBN?
GeNIe/SMILE, Decision Systems Laboratory, University of Pittsburgh, free downloadable. Runs under MS Windows operating system; compatible with MS Excel Example BBN H2 tank station (compressed)
Many possibilities in scenarios; deterministic approach possible but not do-able, only probabilistic tools work (random distributions, stochastic variables) • Crux of Bayesian approach is improving existing knowledge by using new information. (Posterior = Prior distribution × Likelihood by new data) • Safety is learning from the past. This approach applies to data and to models. • BBN software developed by artificial intelligence groups provides easy handle • Bayesian Belief Nets can reflect transparently scenario complexities. • In addition, they can be extended to Influence Diagrams including options and sensitivity analysis. This approach enhances decision making. • Bayesian is particularly useful in case of few data and uncertainty. Belief alludes to subjective probability and the inclusion of expert opinion. Why Bayesians?
Top: Compressed H2 station Bottom: Liquid H2 truck Top right: Liquid H2 station Bottom: Compressed H2 truck Example case of H2 refueling stations and tank trucks
Scaled 50% lethal effect area equations developed for various types of fires and vapor cloud explosion (SI units: area in m2, mass in kg, leak size in kg/s).
. In part assumed and otherwise resulting ignition probabilities
Societal risk F-N curves for the two refueling stations and the three transportation modes Assumed population density 4000 /km2
EAL is composed of: - Structural damage 1000 $/m2 - Value of life lost 2 million $/fatality (rather low) Individual risk (IR) distances (per million years, in meter) and Expected Annual Loss (EAL) in 1000 $/yr
to investigate where main risks can be found so that preventive or protective risk reducing measures can be taken or embodied in standards and codes. • to plan use of space (land use planning, LUP) or to obtain a license for an activity. • to help emergency response planning (which would benefit from information about expected numbers of injured persons). • to perform business risk management and enable a cost-benefit analysis, CBA. The result of a risk assessment can be used in different ways:
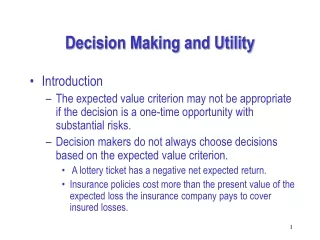
Utility is a way to express feelings of desirability of consequence attributes of a decision; so it can indicate a decision maker’s preferences of risky yield vs. fixed gain Decision tree of (probabilistic) options: Concept developed in economics (vN-M). Desirability depends on wealth and risk. Decision maker has to be ’calibrated’. Risk aversion larger with d2U/dY2 more neg. Yield is stochastic: hence E(Y), Var(Y) Utility decreases with larger uncertainty: Fixed gain -0.5(U”/U’)·Var(Y) Utility, Uncertainty and Decision Tree Value of information
Influence diagram and sensitivity limits GeNIe/SMILE, Decision Systems Laboratory, University of Pittsburgh, free downloadable
Value of Information, or • Control to Reduce Uncertainty 14
BBN tool extends our possibilities, however the thinking you still have to do yourself! • We did not explore yet all of the available features, and there are variants such as DUT UniNet. So, try it out! • Various kinds of distributions of data and models can be facilitated. Main problem remains lack of validated data. • QRA, uncertainty analysis, and decision support tools are the future in the framework of Risk Management, but need further development! Conclusions
Increase in risk aversion U d2U/dY2 = U”< 0 Yield = (Returns - AccRisk) Stochastic variable