Download
1 / 20
200 likes | 398 Views
John Lacy November 8, 2010. Enabling Data Infrastructure for Utility Sustainability. Enabling Smart Grid components. Generation Transmission & Distribution Meters Hardware Consumers Smart Infrastructure. Smart Smart Smart Smart Smart.

E N D
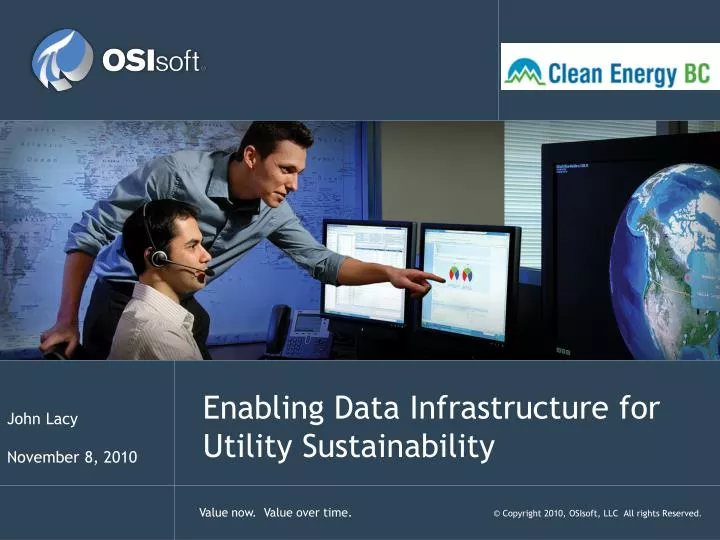
John Lacy November 8, 2010 Enabling Data Infrastructure for Utility Sustainability
Enabling Smart Grid components • Generation • Transmission & Distribution • Meters • Hardware • Consumers • Smart Infrastructure Smart Smart Smart Smart Smart – “The Enabler”
Beyond AMI: Example Data Flows Asset Information Second or SCADA 1 - n Sub - second Mobile GIS PI WMS daily reads Dispatch AMR collected daily 30 minute collected hourly Metered Feeder Data 30 minute Near - real time DMS collected hourly transformer kW , OMS device loading , voltages , etc . 5 minute reads continuously Feeder Amps and Circuit other SCADA Data AnalysisTool 15 minute / hourly 15 minute / hourly C & I Interval Access to all data Distribution Planning n AMI 5 minute / hourly ( Future ) Access to all data Distribution Operations Access to all data Field Engineering Financial Systems of Source devices will evolve Record with new technologies and ( data streams not Accounting CIS cost effectiveness included in this scenario ) IED Access to all data § CBM 15 minute Asset Management / collected daily Substations HAN Capacitor Control Multi - year history and reporting System flexibility for analysis such as : § PF / Voltage / Var § DG § Loss Manual Monthly § Load Substation Reads Multi - year history and real and near real - time data for : § Capacitor Operations § DG Status Multi - year history and real and near Various data granularity real - time data for : and delivery frequencies § PF / Voltage / Var Analysis that will increase over time § Capacitor Operations
Smart Infrastructure - “The Enabler” • DATA MANAGEMENT INFRASTRUCTURE is ESSENTIAL • Need a home for all this data – accessible & highly available • Underpins and supports the entire Smart Grid • Connectivity to disparate devices and data sources • Data collection at original resolution – milliseconds to minutes • Liberate data from secure, locked down proprietary systems • Data analysis – ad hoc, event based, in real time • Transformation to information for decision support • Scalable – to millions of meters and values • Extensible – to other databases, applications • Communications – robust, fast, bidirectional
Smart Generation • Multiple Control systems’ data aggregated to improve unit and plant performance
Phase Angle Jumping - Grid Stability Notice frequency is relatively stable 5:10 PM 5:00 PM Phase Angle difference Continuing to grow. Diff 120⁰ 60⁰
13 of top 15 Owner/Operatorsusing PI to Manage Wind Farms Source: Emerging Energy Research
Value Propositions • Turbine Manufacturer Warranty Management • “Fox Watching the Hens” • “Bathtub Curve” Implications for LTSA Concept • Need: Focus on Top-Ten Sources • Increasing kWh produced – Wind Farm Operations • Turbine Availability • Turbine Operating Efficiency • Increasing value of kWh produced – Utility Operations • Improving utility integration (forecasting and scheduling) • Improving market value of power (real-time info to power marketing/trading floor) • VAR/Grid Stability Management • “Intangibles” – Corporate Requirements • Enterprise Integration, • Separation of Process Control Network from User/Enterprise • Regulatory & Reporting • Technology Risk Management – Perception and Reality
Asset Management Value PropositionTurbine Production Example • A typical utility scale wind farm may have 30 to 200 Turbines • Large owners (e.g. Iberdrola – 3500MWs) may have thousands of turbines • A single percentage point gain/loss of “in-market” availability (e.g. turbines available to operate when the wind is blowing) for • Iberdrola Total Fleet would result • in a 1st Year ROI/loss of $4.3MUSD. • NPV over 5 Years = $13.5MUSD @ 18% Discount Rate • Based on US prices, power rate in Spain is .07 to .10/kWh produced • For a Single Wind Farm of 150MWs: • In a 1st year ROI of $185,000 • NPV over 5 years = $576,000 @ 18% Discount Rate
“Roll-up” Mechanism: Net KWh Roll-Up • Key Points • Each trend shown is aggregated load (kWh) up to the next higher trend from an individual meter, transformer, line segment, breaker and sub. • If you overlay the Distribution SCADA load, the difference would be losses or leakage • The physical model (CIM) allowing the aggregation and roll-up of individual loads • End to end visibility – integrating meter and distribution system(s) operational data All AMI meters summed to one distribution transformer All distribution transformers summed to circuit segment Load on meter data Total feeders summed to sub Circuit segment summed up to feeder 18