Download
1 / 9
90 likes | 228 Views
September 18, 2012 Analyzing Graphs of Functions. Warm-up: Talk to your group about the Distance Formula worksheet given last week. Make sure you understand how it was derived. You should be able to derive it on your own without the worksheet. Find the distance and midpoint between

E N D
September 18, 2012Analyzing Graphs of Functions Warm-up: Talk to your group about the Distance Formula worksheet given last week. Make sure you understand how it was derived. You should be able to derive it on your own without the worksheet. • Find the distance and midpoint between (3, -1) and (10, 6). 2. Write the equation of a circle whose endpoints of the diameter are (-4, -1) and (4, 1)
y y y 5 5 5 x x x -5 -5 -5 5 5 5 -5 -5 -5 What do you remember about functions? Determine whether the graph of y is a function of x: *Hint: Vertical Line Test 1. 2. 3. What does it mean to “find the zeros” of a function? Find the zero of the function: a) f(x) = 3x2 + 22x – 16 b)
Do you remember Interval Notation? Write the following sets in interval notation, then graph it on a number line. For example: {x| x > 5} ---> (5, ∞) “ ( “ -- does not include the value “ [ “ -- includes the value
CW 1.5: Pg. 61-62 #9-12, 15-24 Bring calculator next class!
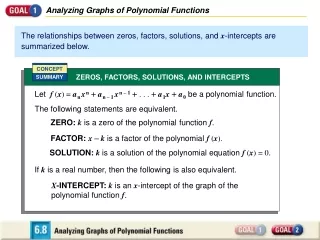
Lesson 1.5Analyzing Graphs of Functions The graph of a function is the collection of ordered pairs (x,f(x)), such that x is in the domain of f. Remember f(x) is the same as the y values!
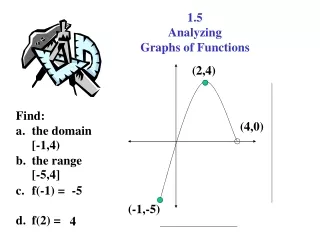
Finding the Domain and Range of a FunctionExample 1: Use the graph to answer the following: a) Find the domain and range: The domain is all the possible x values. Domain: [-1, 5) Same as saying: -1 ≤ x < 5 The range is all the possible y values. Same as saying: -3 ≤ y ≤ 3 Range: [-3, 3] b) Find the indicated values for the following: f(-1) = f(2) = “When x = -1, y = ?” “When x = 2, y = ?”
Practice:Find the Domain and Range y = sin (x) 1. 2. 3. Find f(0) for both graphs.
Example 3: Increasing and Decreasing Functions Determine the intervals over which the function is increasing, decreasing, or constant. Analyze where y values of the graph go up and down. Increasing at (-∞, 0) Constant at [0, 2] Decreasing at (2, ∞) Increasing at (-∞, -1) Decreasing at (-1, 1) Increasing at (1, ∞) The function is increasing over the entire real line.
Graphing Calculator ActivityPg. 63 #39-47odd How to find the relative minimum and maximum values in your calculator. • Graph the function in “Y =“ • 2nd Calc • Select whether you are finding the min or max • Left Bound? (Place the cursor to the left of the min/max, then press enter) • Right Bound? (Place cursor to the right of the min/max, then press enter) • Guess? (Pres enter) • It should give you the min or max of the function *This should also work to find the “zeros” in your function.