Download
1 / 38
390 likes | 614 Views
Chapter 6 – Part 4. Process Capability. Meaning of Process Capability. The capability of a process is the ability of the process to meet the specifications. A process is capability of meeting the specification limits if at least 99.73 % of the product falls within the specification limits.

E N D
Chapter 6 – Part 4 Process Capability
Meaning of Process Capability • The capability of a process is the ability of the process to meet the specifications. • A process is capability of meeting the specification limits if at least 99.73% of the product falls within the specification limits. • This means that the fraction of product that falls outside the specification limits is no greater than 0.0027, or that no more that 3 out of 1,000 units is “out of spec.” • Our method of computing process capability assumes that the process is normally distributed.
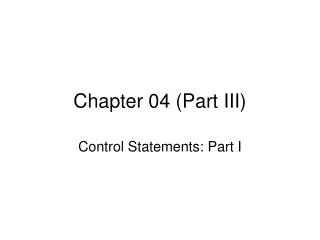
Control Limits vs. Spec. Limits • Control limits apply to sample means, not individual values. • Mean diameter of sample of 5 parts, X-bar • Spec limits apply to individual values • Diameter of an individual part, X
Mean= Target Control Limits vs. Spec. Limits Samplingdistribution, X-bar Processdistribution, X USL LSL Lowercontrollimit Uppercontrollimit
Requirements for Assessing Process Capability • To assess capability of a process, the process must be in statistical control. • That is, all special causes of variation must be removed prior to assessing capability. • Also, process performance characteristic (e.g., diameter, bake time) must be normally distributed.
Cp Index USL = upper specification limit LSL = Lower specification limit
Cp Index • We want the spread (variability) of the process • to be as ??? • If the spread of the process is very ????, the • capability of the process will be very ????
Cp Index USL LSL Width of spec limits = USL - LSL Processdistribution, X Spread of Process = USL - LSL
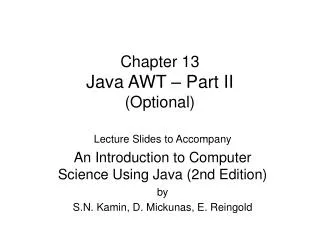
Process is Barely Capable if Cp = 1 .9973 .00135 .00135 X LSL USL Spread of process matches the width of specs. 99.73% of output is within the spec. limits.
Process Barely Capable if Cp = 1 If , what does this imply regarding the spec. limits? Cp=1 LSL = USL =
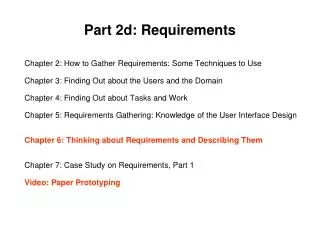
Process is Capable if Cp > 1 >.9973 < .00135 < .00135 X LSL USL Spread of process is less than the width of specs. More than 99.73% of output is within the spec. limits.
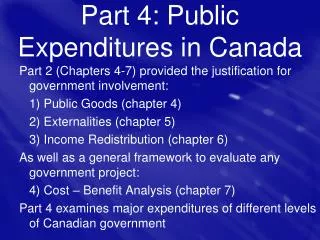
Process is Not Capable if Cp < 1 < .9973 > .00135 > .00135 X LSL USL Spread of process is greater than the width of specs. Less than 99.73% of output is within the spec. limits.
X Sugar Example Ch. 6 - 3
Capability of Sugar Process USL = 20 grams LSL = 10 grams
Capability of Sugar Process • Since Cp <1, the process is not capability of meeting the spec limits. • The fraction of defective drinks (drinks with either too much or not enough sugar) will exceed .0027. • That is, more than 3 out of every 1000 drinks produced can be expected to be too sweet or not sweet enough. • We now estimate the process fraction defective, p-bar.
LSL USL F1 F2 Mean Estimated Process Fraction Defective • What is the estimated process fraction defective -- the percentage of product out of spec? p-bar = F1 + F2
Estimated Process Fraction Defective • We can then use Cp to determine the p-barbecause there is a simple relationship between Cp and z: z = 3Cp (See last side for deviation of this result.) • Suppose, Cp =0.627 z = 3(0.627) =1.88
Estimated Process Fraction Defective • The z value tells us how many standard deviations the specification limits are away from the mean. • A z value of 1.88 indicates that the USL is 1.88 standard deviations above the mean. • The negative of z, -1.88, indicates that the LSL is 1.88 standard deviations below the mean. • We let Area(z) be the area under the standard normal curve between 0 and z.
Process Fraction Defective Area(z) = Area(1.88) = 0.4699 LSL USL F2 0 z =1.88 F2 = % above USL = .5000 - 0.4699 = .0301
LSL USL F1 F2 0 Process Fallout p-bar = 2[.5 – Area(z)] = F1 + F2 0.4699 z =1.88 p-bar = 2(.5 – .4699) = 2(.0301)=.0602
Soft Drink Example Cp =0.33 z = 3Cp = 3(0.33) = 0.99 Area(z) = Area(0.99) = 0.3389 p-bar = 2[.5 - Area(0.99)] = 2[.5 - 0.3389] = 0.3222
Capability Index Based on Target • Limitation of Cp is that it assumes that the process is mean is on target. Process Mean = Target Value = (LSL + USL)/2
CT Capability Index • With Cp, capability value is the same whether the process is centered on target or is way off. • Cp is not affected by location of mean relative to target. • We need capability index that accounts for location of the mean relative to the target as well as the variance. • CT is an index that accounts for the location of mean relative to target.
CT Capability Index If process is centered on target, If process is off target,
Example of CT LSL = 10, USL = 20, estimated standard deviation = 5.0 and estimate process mean = 15.33. Compute CT.
CT Capability Index If process mean is adjusted to target,
CT Capability Index • Cpis the largest value that CTcan equal. • Since Cp = 2.2 and CT = .44, the difference is the maximum amount by which we can increase CTby adjusting the mean to the target value.