Download
1 / 11
110 likes | 198 Views
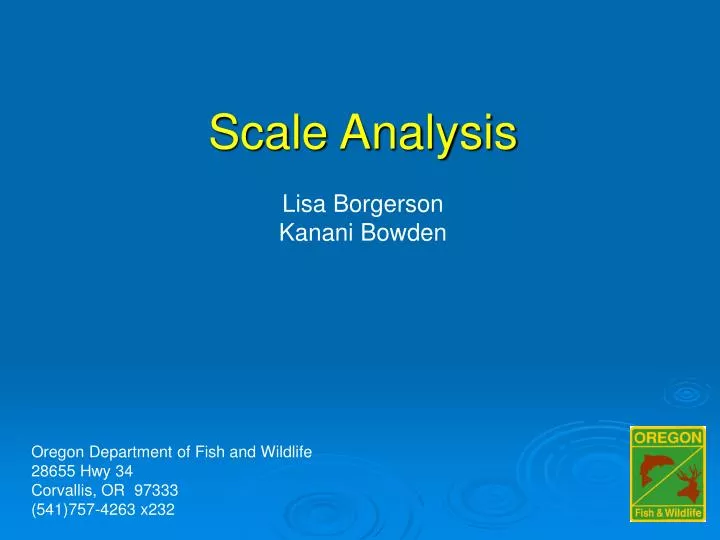
Scale Analysis Lisa Borgerson Kanani Bowden. Oregon Department of Fish and Wildlife 28655 Hwy 34 Corvallis, OR 97333 (541)757-4263 x232. What We Learn From Scale Analysis :. Age and Growth Hatchery vs Wild Life History Species ID. For Project CROOS we determine TOTAL AGE only.

E N D
Scale Analysis Lisa Borgerson Kanani Bowden Oregon Department of Fish and Wildlife 28655 Hwy 34 Corvallis, OR 97333 (541)757-4263 x232
What We Learn From Scale Analysis: • Age and Growth • Hatchery vs Wild • Life History • Species ID For Project CROOS we determine TOTAL AGE only
Annulus 3 Annulus 2 Annulus 1 Ocean Entrance
Age Composition of CROOS chinook by month, 2006 _______________________________________________________ Percentage of sample Number of Month Age 2 Age 3 Age 4 Age 5 Age 6 scales aged ______________________________________________________ June 0.0 30.5 59.4 9.9 0.0 131 July 0.0 36.0 59.7 3.7 0.6 705 August 0.0 43.8 51.7 4.0 0.5 201 September 0.2 77.8 18.4 3.2 0.5 657 October 0.0 77.9 18.0 3.5 0.6 316 Total 0.1 57.0 38.5 3.9 0.5 2,045 Coastal OR CHF SGS 0.2 7.4 38.6 43.0 10.8 1,266
Age Composition of CROOS chinook by month, 2007 _______________________________________________________ Percentage of sample Number of Month Age 2 Age 3 Age 4 Age 5 Age 6 Age 7 scales aged _______________________________________________________________________________________________________________________________________ May -- 21.5 63.3 14.6 0.6 -- 158 June -- 29.7 54.8 14.8 0.0 0.7 155 July -- 56.3 34.7 8.8 0.2 -- 579 August 0.1 60.7 34.2 4.7 0.3 -- 1,324 September -- 68.0 24.6 5.7 1.7 -- 175 October -- 35.4 32.3 27.7 4.6 -- 65 Total 0.04 55.0 36.8 7.6 0.5 0.04 2,456 ________________________________________________________
Age composition of Chinook salmon sampled by Area in 2007 ________________________________________________________________ Management Percentage at Age Number of Area 2 3 4 5 6 Scales Read ________________________________________________________________ N. Oregon Coast -- 33.9 42.5 20.9 2.4 292 S. Oregon Coast 0.1 57.9 36.2 5.5 0.3 1,696 Klamath Mgt Zone -- 57.9 35.3 6.8 -- 468 Elk R. Bubble -- 23.3 53.5 18.6 4.6 na Chetco R. Bubble -- 31.0 27.6 41.4 -- 29 Total 0.04 54.2 36.0 8.2 0.6 na
Age composition of Chinook salmonstock groups sampled in the ocean troll fishery off Oregon in 2007 ________________________________________________________________ Stock Percentage at Age Number of Group 2 3 4 5 6 7 Scales Read ________________________________________________________________ British Columbia/ SE Alaska -- 11.5 36.6 53.9 -- -- 26 Washington -- 44.0 48.0 4.0 -- 4.0 25 Columbia River -- 34.3 42.4 22.6 0.7 -- 137 Oregon Coast -- 38.4 45.1 15.1 1.4 -- 708 California 0.1 63.6 32.8 3.3 0.2 -- 1,632 N OR Coast 0.0 10.0 23.3 53.3 13.3 -- 30 Mid OR Coast 0.0 30.0 52.4 15.0 2.6 -- 227 Rogue 0.0 49.1 42.2 8.7 0.0 -- 275 N CA/S OR 0.0 37.5 43.8 18.7 0.0 -- 176 California 0.1 63.6 32.8 3.3 0.2 -- 1632 Klamath 0.1 72.3 25.9 1.6 0.1 0.0 1,232 CA Coast 0.0 49.2 40.4 9.3 1.1 0.0 184 Central Valley 0.0 26.4 65.7 7.9 0.0 0.0 216
Comparison of contribution of Klamath stock (all ages) with Age-3 fish (all stocks) in Oregon Troll fishery, 2007 100 80 60 Percent contribution 40 20 0 May June July August September October NOC-Kl NOC-age 3 SOC-Kl SOC-age 3 KMZ-Kl KMZ-age 3
Comparison of contribution of Central Valley (all ages) with contribution of Age-4 fish (all stocks) in Oregon Troll Fishery, 2007 70 60 50 40 Percent contribution 30 20 10 0 May June July August September October NOC-CV NOC-age 4 SOC-CV SOC-age 4 KMZ-CV KMZ-age 4
Future Plans: • Continue to explore stock-age relationships • Determine if we can identify maturing and non maturing fish from their scales