Download
1 / 32
330 likes | 355 Views
Rating Scale Analysis. Michael Glencross Community Agency for Social Enquiry (CASE) UK Stata Users Group Meeting 10 September 2009. Rationale. Attitudes, beliefs, opinions are often measured by means of a set of Likert items

E N D
Rating Scale Analysis Michael Glencross Community Agency for Social Enquiry (CASE) UK Stata Users Group Meeting 10 September 2009
Rationale • Attitudes, beliefs, opinions are often measured by means of a set of Likert items • A Likert item is a statement which the respondent is asked to evaluate according to some subjective or objective criteria • Usually the level of agreement or disagreement is measured
Rationale • The format of a typical 5-point Likert item is: • Strongly disagree • Disagree • Neither agree nor disagree • Agree • Strongly agree
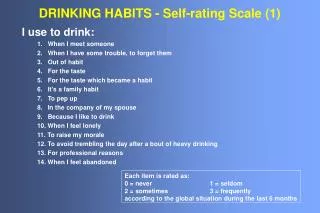
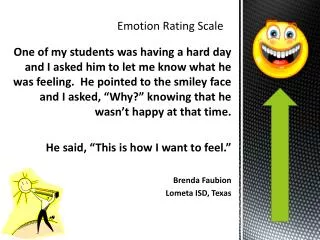
Likert Item Rate your level of agreement with the following statement:
Rationale • It is desirable to have a measure of the amount of agreement or disagreement in the sample • This is preferable to making an arbitrary decision
Example 1Respondents: Disagree/Undecided/Agree?(1=SD; 2=D; 3=U; 4=A; 5=SA)
Example 2Respondents: Disagree/Undecided/Agree? (1=SD; 2=D; 3=U; 4=A; 5=SA)
Example 3Respondents: Disagree/Undecided/Agree? (1=SD; 2=D; 3=U; 4=A; 5=SA)
Cooper (1978) • N respondents, r response categories, S total score • Sampling distribution of z is approx standard normal (N large)
Whitney (1978) • N respondents, r response categories, S total score • Sampling distribution of t is approx tN-1 (N small)
Hsu (1979) • Calculates the variance ( ) of the N ratings in the sample • This is compared with the variance ( ) of the null distribution of ratings • The ratio has a distribution that is approximately • For approx normal dist of population ratings,
Hsu • significantly large → heterogeneity of ratings, i.e., disagreement
Hsu • significantly small → homogeneity of ratings, i.e., agreement
Likert.do • If N > 200, calculates Cooper z and displays appropriate message: • Result is significant, p<0.01, i.e., there is strong evidence that the respondents agree with the statement • Result is significant, p<0.05, i.e., there is evidence that the respondents disagree with the statement • Result is not significant, i.e., there is evidence that respondents are undecided about the statement
Likert.do • If N <= 200, calculates Whitney t and displays appropriate message • Result is significant, p<0.01, i.e., there is strong evidence that the respondents disagree with the statement • Result is significant, p<0.05, i.e., there is evidence that the respondents agree with the statement • Result is not significant, i.e., there is evidence that respondents are undecided about the statement
Likert.do • If z or t are not significant, calculates Hsu and displays appropriate message: • The lack of significance is associated with significant (p<0.01) heterogeneity (disagreement) of population ratings • The lack of significance is associated with significant (p<0.05) homogeneity (agreement) of population ratings • The lack of significance is not associated with any significant heterogeneity (disagreement) or homogeneity (agreement) of population ratings
Example 1: Analysis • N=627 • N > 200 so use Cooper z • Mean_c = 2.8070175 • Cooper z = -3.416934 • Result is significant, p<0.01, i.e., there is strong evidence that respondents disagree with the statement
Example 2: Analysis • N=468 • N > 200 so use Cooper z • Mean_c = 3.1346154 • Cooper z = 2.0592194 • Result is significant, p<0.05, i.e., there is evidence that the respondents agree with the statement
Example 3: Analysis • N=542 • N > 200 so use Cooper z • Mean_c = 3.0369004 • Cooper z = .60745674 • Result is not significant, i.e., there is evidence that respondents are undecided about the statement • The lack of significance in Cooper z is not associated with any significant heterogeneity (disagreement) or homogeneity (agreement) of population ratings
Stata code (1) capture program drop likert *! likert v1.1 MJ Glencross 13 August 2009 program define likert, rclass version 9.2 syntax varlist (max=1 numeric) quietly summarize `varlist' gen N=r(N) gen S=r(sum)
Stata code (2) if N>200 { display "N > 200 so use Cooper z" display " Mean_c = " r(mean) gen z=(r(sum)-3*N)/sqrt(2*r(N)) display "Cooper z = " z if z>2.58 { display "Result is significant, p<0.01" display "i.e., there is strong evidence that the respondents agree with the statement" } else if z>1.96 & z<2.58 { . . .
Stata code (3) . . . else{ gen chisq01=invchi2tail((r(N)-1),0.01) gen critvar01=(0.764*chisq01)/(r(N)-1) gen chisq05=invchi2tail((r(N)-1),0.05) gen critvar05=(0.764*chisq05)/(r(N)-1) . . .
Stata code (4) . . . if abs(z)<1.96 & critvar01<0.764 { display "The lack of significance in Cooper z is associated with significant (p<0.01) heterogeneity (polarisation/disagreement) of population ratings" } else if abs(z)<1.96 & critvar01>0.764 & critvar05<0.764 {
Stata code (5) else { display "N <= 200 so use Whitney t" display " Mean_t = " r(mean) gen isq= `varlist'*`varlist' quietly summarize isq gen t=(S-3*N)/sqrt((N*r(sum)-S^2)/(N-1)) display "Whitney t = " t
Stata code (6) gen T=ttail((r(N)-1),t) if t>0 & T<0.01{ display "Result is significant,p<0.01" display "i.e., there is strong evidence that the respondents agree with the statement" } else if t>0 & T<0.05 & T>0.01 {. . .
Stata code (7) if T>0.05 & critvar01<0.764 { display "Lack of significance in Whitney t is associated with significant (p<0.01) heterogeneity (polarisation/disagreement) of population ratings" } . . . . . . } } end
Other issues • Assumptions about a Likert item • Interval level data? Use parametric analysis • Ordinal (ordered categorical) data? Use non-parametric analysis • Likert scale is a summation of Likert items • Unidimensional scale is implied. How do you know? Principal component analysis? Correspondence analysis? • Assumptions about Cooper z, Whitney t and Hsu chi sq
Problems of Likert Scales • Response set • tendency to give identical responses, regardless of item content • Response style • tendency to favour a particular subset of responses (SA or D) • Agreement bias • tendency to agree with statements regardless of content
Problems of Likert Scales • Social desirability bias • tendency to provide responses to please interviewer • Assumed ordinality • assumption that SA > A > U > D > SD • Meaning of middle category • “Undecided” might be a genuine neutral or just a ‘safe’ option
Further Research • Develop tests (z and t) for difference between two Likert items • Develop test for differences between three or more items (ANOVA, Kruskal-Wallis) • Rating scales and Item Response Theory models (1-, 2- and 3-parameter models)
Further Research • Use Likert scale data as a basis for obtaining interval level estimates on a continuum by applying the polytomous Rasch model • Model allows testing of hypothesis that statements represent increasing levels of attitude • Not all Likert scaled items can be used
References • Cooper, M. (1978) An exact probability test for use with Likert-type scales. Educational and Psychological Measurement,36, 647-655. • Hsu, L. (1979) Agreement or disagreement of a set of Likert-type ratings. Educational and Psychological Measurement, 39, 291-295. • Whitney, D. R. (1978) An alternative test for use with Likert-type scales. Educational and Psychological Measurement, 38, 15-18.