Download
1 / 30
300 likes | 455 Views
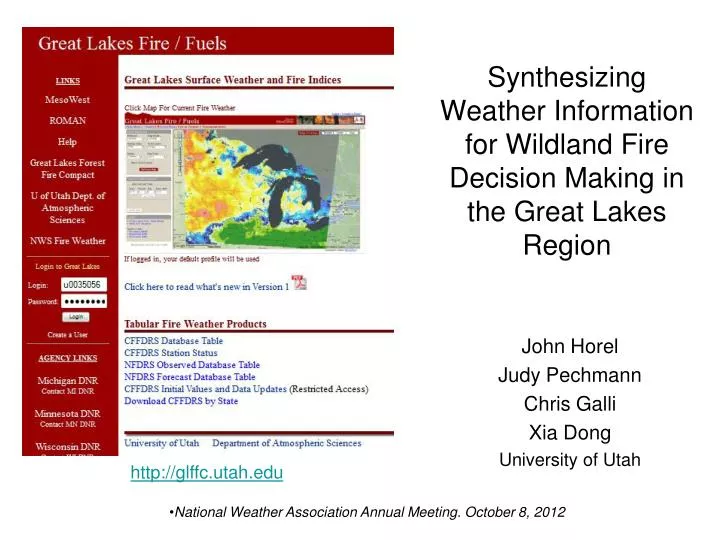
Synthesizing Weather Information for Wildland Fire Decision Making in the Great Lakes Region. John Horel Judy Pechmann Chris Galli Xia Dong University of Utah. http://glffc.utah.edu. National Weather Association Annual Meeting. October 8, 2012. Outline.

E N D
Synthesizing Weather Information for Wildland Fire Decision Making in the Great Lakes Region John Horel Judy Pechmann Chris Galli Xia Dong University of Utah http://glffc.utah.edu • National Weather Association Annual Meeting. October 8, 2012
Outline • Motivation and applications of Great Lakes Fire and Fuels Information System in Lakes States • Evaluating fire danger and behavior indices calculated from station and gridded weather information • Applications throughout continental United States
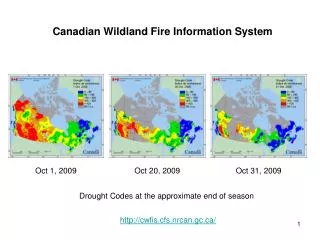
Objective Provide retrospective, current, and forecast information regarding weather and fuel conditions in the Great Lakes region • Pagami Creek Fire, MN 9/11/11
Key Contributors & Participating Agencies • Robert Ziel, Lake States Fire Science Consortium • James Barnier, Wisconsin DNR • Don Johnson, Michigan DNR • Doug Miedtke, Minnesota DNR
Integrating Fire and Fuel Information Systeminto State operations • Wisconsin • Michigan • Minnesota Operational since 2011
Critical Design Features • Provide comprehensive weather information integrated with modeled fire danger, behavior, and effects information in a single web portal; • Use weather information and prior fuel state to compute, archive, and display CFFDRS indices; • Map displays, tabular listings, and time series graphics in a variety of formats with focus on daily products valid at 1800 UTC; • Allow approved users to initialize and adjust as needed fuel state information, wind speed multipliers, and fire danger rating thresholds; • Allow all users to save product profiles to return to products tailored to their needs; • Diagnose weather and fuel state throughout the region by incorporating NWS gridded analyses and forecasts as well as station observations.
Underlying Weather Information • Integrate weather observations with gridded analyses and forecasts • Retrieve, access, and display weather information via MesoWest (http://mesowest.utah.edu) • Observations from selected networks : RAWS (93); NWS (30); & EnviroWeather (41) • Hourly 5 km analyses of temperature, wind, relative humidity, and precipitation obtained from the NCEP Real Time Mesoscale Analysis (RTMA) • Forecast weather values for 6-hour periods out to 2 days four times per day from the NWS National Digital Forecast Database (NDFD)
Duck Lake Fire MI • 21,069 acres — largest wildfire in MI since 1980 • Started by Lightning May 23, 2012 • 136 structures lost (49 cabins/homes)
Fire Weather Information module of the CFFDRS (adapted from Taylor and Alexander 2006). Shading denotes codes and indices that are computed hourly as well as daily.
Buildup Index: Moisture Content of litter, duff, and humus fuels on forest floor Extreme Very High Duck Lake fire
Fire Weather Index: 5/24/12 Computed from station observations Low Moderate High Very High Extreme
Fire Weather Index: 5/24/12 Computed from station observations & RTMA analyses Low Moderate High Very High Extreme • Ely
Outline • Motivation and applications of Great Lakes Fire and Fuels Information System in Lakes States • Evaluating fire danger and behavior indices calculated from station and gridded weather information • Applications throughout continental United States
Known Issues • Wind speeds differ from sensors at 10 m (NWS), 6 m (RAWS), and 3 m (Enviro-Weather) • Higher wind speeds from gridded products (analyses and forecasts) than from observations • Forecast discontinuities across CWA boundaries for wind, temperature, relative humidity, and rainfall • Sensitivity to precipitation totals • Representativeness of station observations • Missing RTMA grids • Incomplete radar coverage affecting RTMA grids
Spincich Lake 24 h accumulated precipitation Missing RTMA grid Extreme Very High Duck Lake fire
Daily FWI RTMA Analysis and NDFD 48 h forecast VT 18 UTC 24 May 2012 NDFD CWA boundary discontinuity
Joint distribution of precipitation from observations (o) and RTMA analyses (a) in percent of the total number of analysis-observation pairs (N= 24211) over the period 1 April – 15 September 2012. Also shown are the marginal distributions of the forecasts p(a) and observations p(o) and the overall Hit Rate (HR).
Joint distribution of precipitation from observations (o) and RTMA analyses (a) in percent of the total number of analysis-observation pairs (N= 24211) over the period 1 April – 15 September 2012. Also shown are the marginal distributions of the analyses p(a) and observations p(o) and the overall Hit Rate (HR).
Joint distribution of precipitation from observations (o) and 48 h forecasts (f) in percent of the total number of forecast-observation pairs (N= 24211) over the period 1 April – 15 September 2012. Also shown are the marginal distributions of the forecasts p(a) and observations p(o) and the overall Hit Rate (HR).
Joint distribution of daily FWI from observations (o) and RTMA analyses (a) in percent of the total number of analysis-observation pairs (N= 24195) over the period 1 April – 15 September 2012. Also shown are the marginal distributions of the analyses p(a) and observations p(o) and the overall Hit Rate (HR).
Joint distribution of daily FWI from observations (o) and 48 h forecasts (f) in percent of the total number of analysis-observation pairs (N= 24195) over the period 1 April – 15 September 2012. Also shown are the marginal distributions of the analyses p(a) and observations p(o) and the overall Hit Rate (HR).
FWI Root Mean Squared Error between RTMA and 24 h & 48 h Forecasts 1 April – 15 Sept 2012
Joint distribution of daily FWI from RTMA analyses (a) and 48 h forecasts for the Lakes States in percent of the total number of analysis-forecast pairs (N= 3,127,944) over the period 1 April – 15 September 2012. Also shown are the marginal distributions of the analyses p(a) and observations p(o) and the overall Hit Rate (HR).
Outline • Motivation and applications of Great Lakes Fire and Fuels Information System in Lakes States • Evaluating fire danger and behavior indices calculated from station and gridded weather information • Applications throughout continental United States
FWI Root Mean SquaredError 1 April – 15 Sept 2012
Joint distribution of daily FWI from RTMA analyses (a) and 48 h forecasts over the continental U.S. in percent of the total number of analysis-forecast pairs (N=45,125,922) over the period 1 April – 15 September 2012. Also shown are the marginal distributions of the analyses p(a) and observations p(o) and the overall Hit Rate (HR).
Summary • Comprehensive weather information integrated with fire danger, behavior, and effects information in a single web portal • Used operationally during 2011 and 2012 fire seasons • CFFDRS values computed from RTMA and short duration NDFD forecasts comparable to those computed from observations but sensitive to sensor heights and precipitation estimates • Gridded analyses and forecasts provide considerable additional information for fire weather professionals to evaluate weather and fuel state • Capabilities developed for the Lakes States applicable nationwide but would require regional calibration of initial values and appropriate threshholds for fire danger ratings