Download

1 / 22
220 likes | 363 Views
Projecting the Impact of State Portfolio Standards on Renewable Energy and Solar Installations. Ryan Wiser and Mark Bolinger January 20, 2005. Project Scope. Estimate and summarize potential impacts of existing state renewable portfolio standards (RPS) on renewable energy capacity and supply

E N D
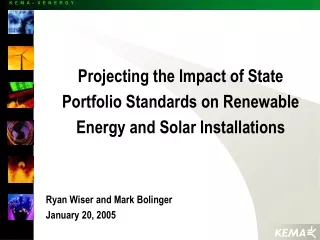
Projecting the Impact of State Portfolio Standards on Renewable Energy and Solar Installations Ryan Wiser and Mark Bolinger January 20, 2005
Project Scope • Estimate and summarize potential impacts of existing state renewable portfolio standards (RPS) on renewable energy capacity and supply • Estimate and summarize potential impacts of state RPS solar set-asides on solar photovoltaic (PV) capacity and supply • Compare both data series with expectations for California RPS and solar capacity and supply
RPS Demand Used updated estimates from Union of Concerned Scientists (1/03/05) for non-CA RPS states UCS assumes mix of renewable resources, which can vary by state, to translate MWh of renewable energy supply to MW of capacity (44% average capacity factor among states) Used estimates from CEC’c Accelerated Renewable Energy Development report for CA MW and MWh, assuming accelerated 20% by 2010 target and that entire state meets target Assumes that RPS requirements are achieved Solar PV Demand Constructed own estimates of demand from solar set-asides within existing state RPS Compared to CA 2004 PV installations, and 3,000 MW solar goal by 2018, based on Governor’s Initiative Generally assumes that solar set-asides are achieved Detailed assumptions on obligated load, load growth, use of credit multipliers, PV/CSP compliance, extent of compliance, capacity factors detailed are in excel worksheets Low/high scenarios used to bound plausible assumptions Data Sources and Methods Because RPS demand and solar PV demand are estimated differently, they are not entirely comparable
Additional Details on Solar Estimates • New York: Low case assumes PV capacity and energy as estimated in NY RPS cost study (which predicts that 9% of customer-sited resources will come from solar); high case assumes that 50% fraction of customer-sited project tier comes from solar; 15% PV capacity factor and full compliance assumed • Arizona: Low case assumes PV credit multiplier of 2.5, 40% compliance with solar set-aside given limits on funds for compliance, and that 75% of solar set-aside generation comes from PV; high case assumes PV credit multiplier of 1.75, full compliance with set-aside, and that 100% of solar set-aside generation comes from PV; 20% PV capacity factor assumed • Nevada: Low case assumes 30% of solar credits comes from PV; high case assumes 80% of solar credits from PV; 2.4 credit multiplier for PV, 18% PV capacity factor, and full compliance assumed • Colorado: Low case assumes 60% of solar set-aside comes from PV; high case assumes 100% of solar set-aside comes from PV; 1.25 credit multiplier, 18% capacity factor, and full compliance assumed • Pennsylvania: 20% of load obligated in 2007, 30% in 2008, 50% in 2009, 100% in 2010 and thereafter; 15% PV capacity factor and full compliance assumed • New Jersey: Full compliance, all of solar set-aside met with PV, and 15% PV capacity factor assumed • Washington, D.C.: Full compliance, all of solar set-aside met with PV, and 15% PV capacity factor assumed; ignore early-year modest credit multipliers • California: 18% PV capacity factor; 88 MW PV installed in 2004; 3000 MW goal by 2018 Additional details on solar requirements and assumptions provided in Excel workbook
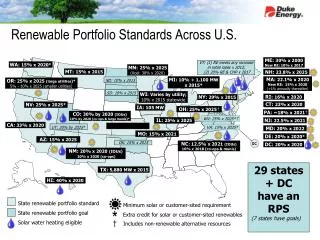
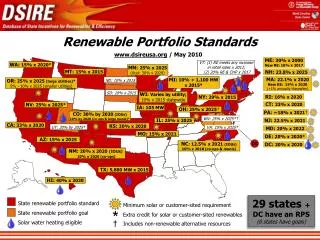
Existing State RPS Requirements: 18 States and Washington D.C. ME: 30% by 2000 MN (Xcel): 825 MW wind by 2007 + 10% by 2015 WI: 2.2% by 2011 MA: 4% new by 2009 NY: 24% by 2013 RI: 16% by 2019 NV: 15% by 2013 CT: 10% by 2010 PA: 8% by 2020 IA: 105 aMW NJ: 6.5% by 2008 MD: 7.5% by 2019 CO: 10% by 2015 CA: 20% by 2010 DC: 11% by 2022 NM: 10% by 2011 AZ: 1.1% by 2007 HI: 20% by 2020 TX: 2880 MW by 2009
Solar Set-Asides: 6 States and Washington, D.C. NY: 0.1542% customer- sited PV, fuel cells, wind by 2013 NV: 0.75% solar by 2013 NJ: 0.16% solar by 2008 PA: 0.5% solar PV by 2020 DC: 0.386% solar by 2021 CO: 0.4% solar by 2015 (half from customer-sited projects) AZ: 0.66% solar by 2007
Key Conclusions – RPS Demand • Aggregate cumulative RPS demand among 18 states and D.C. expected to exceed 100,000 GWh (25,000 MW) of new renewable energy capacity by 2017 • 30% of cumulative RPS-induced new renewable energy demand by 2017 (in GWh) comes from California’s accelerated RPS target, down from 38% in 2010 because 20% RPS target remains constant in California after 2010 • In terms of RPS-induced new renewable energy demand by 2017 (in GWh), other significant state RPS markets are: New York (14%), Pennsylvania (11%), Nevada (7%), Minnesota (7%), Texas (6%), Massachusetts (6%) • As percent of 2002 load and 2003 population, California’s accelerated RPS target alone no longer looks as aggressive, relative to other states
Key Conclusions – Solar PV Demand • By 2010, existingsolar set-asides in other states (not including California) may create demand for 180 – 337 MW of solar PV capacity • Largest markets outside of California are: New Jersey (96 MW) and Arizona (19 - 96 MW) • By 2025, existing solar set-asides in other states (not including California) may create demand for 940 – 1,190 MW of solar PV capacity • Largest markets outside of California are: Pennsylvania (640 MW), New Jersey (110 MW), and Colorado (78–131 MW) • California’s current 88 MW of capacity (as of late 2004) is comparable to the predicted 2025 capacity required by the existing goals of many states; 3,000 MW goal is considerably larger than all other markets combined (other markets total 553 – 792 MW in 2018) • Goals often do not officially extend to 2025, making comparisons above somewhat contrived (e.g., AZ goal extends to 2007, NJ to 2008, NV and NY to 2013, CO to 2015; these standards may be increased beyond these end points) • As percent of 2002 load and 2003 population, California’s current installed capacity looks less aggressive, but 3,000 MW goal remains aggressive in comparison to other states • Non-RPS driven solar demand associated with existing renewable energy fund programs (i.e., rebate programs, outside of CA) unlikely to generate sizable PV demand relative to aggregate impact of solar RPS set-asides estimated here – we therefore ignore this demand driver
Cumulative New Renewable Energy Capacity: CA and Other RPS States (2000-2017)
Cumulative New Renewable Energy Generation: CA and Other RPS States (2000-2017)
New Renewable Energy Generation by 2017 as Percent of 2002 Load and 2003 Population
Non-California PV Generation, Low and High (2000-2025) High Case Low Case
Non-California PV Capacity, Low and High (2000-2025) High Case Low Case
PV Generation by 2020 as Percent of 2002 Load and 2003 Population