Download
1 / 5
50 likes | 132 Views
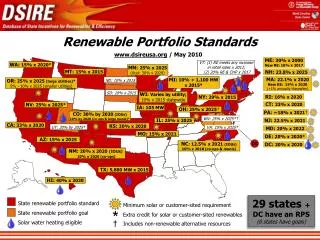
Renewable Portfolio Standards Across U.S. ME: 30% x 2000 New RE: 10% x 2017 . VT: (1) RE meets any increase in retail sales x 2012; (2) 20% RE & CHP x 2017. WA: 15% x 2020*. MN: 25% x 2025 (Xcel: 30% x 2020). MT: 15% x 2015. NH: 23.8% x 2025.

E N D
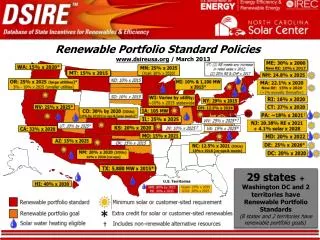
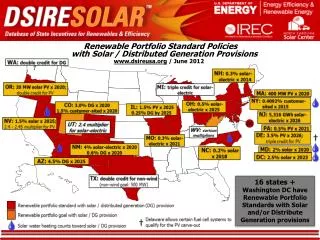
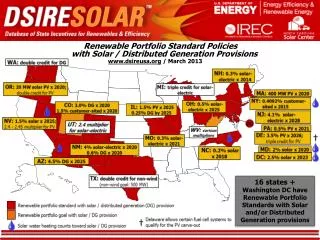
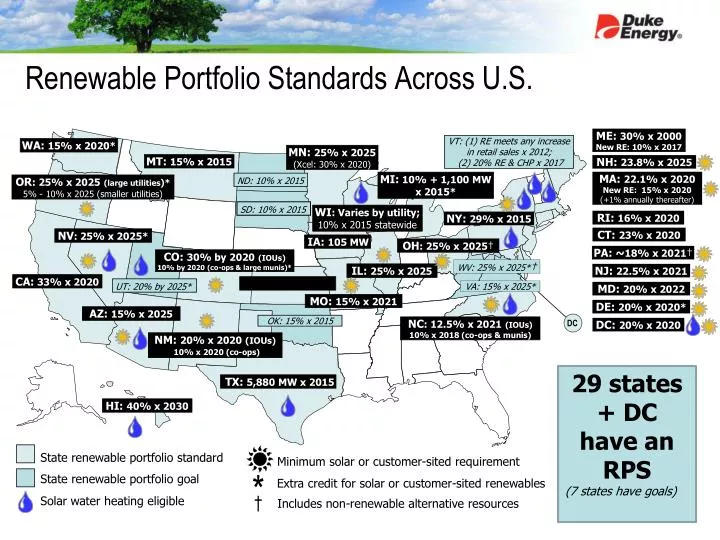
Renewable Portfolio Standards Across U.S. ME: 30% x 2000 New RE: 10% x 2017 VT: (1) RE meets any increase in retail sales x 2012; (2) 20% RE & CHP x 2017 WA: 15% x 2020* MN: 25% x 2025 (Xcel: 30% x 2020) MT: 15% x 2015 NH: 23.8% x 2025 MA: 22.1% x 2020 New RE: 15% x 2020(+1% annually thereafter) MI: 10% + 1,100 MW x 2015* ND: 10% x 2015 OR: 25% x 2025(large utilities)* 5% - 10% x 2025 (smaller utilities) SD: 10% x 2015 WI: Varies by utility; 10% x 2015 statewide RI: 16% x 2020 NY: 29% x 2015 CT: 23% x 2020 NV: 25% x 2025* IA: 105 MW OH: 25% x 2025† PA: ~18% x 2021† CO: 30% by 2020(IOUs) 10% by 2020 (co-ops & large munis)* WV: 25% x 2025*† IL: 25% x 2025 NJ: 22.5% x 2021 CA: 33% x 2020 KS: 20% x 2020 UT: 20% by 2025* VA: 15% x 2025* MD: 20% x 2022 MO: 15% x 2021 DE: 20% x 2020* AZ: 15% x 2025 DC OK: 15% x 2015 NC: 12.5% x 2021(IOUs) 10% x 2018 (co-ops & munis) DC: 20% x 2020 NM: 20% x 2020(IOUs) 10% x 2020 (co-ops) • 29 states + DC have an RPS • (7 states have goals) TX: 5,880 MW x 2015 HI: 40% x 2030 State renewable portfolio standard Minimum solar or customer-sited requirement * State renewable portfolio goal Extra credit for solar or customer-sited renewables † Solar water heating eligible Includes non-renewable alternative resources
Renewable Resource Availability Varies by Region Biomass • Renewable Portfolio Standards, Clean Energy Standards, Renewable Energy Standards have been adopted in 29 states • Renewable resources vary considerably nationally • Resource availabillity significant impactsfeasibility and cost, as well as policy design • Renewable Resource Assessment tailored to South Carolina resource base is essential starting point • Solar PV is rapidly becoming cheaper but other resources, such as biomass direct firing, continue to face regulatory challenges Wind Solar **Please see attached slides for clearer view