Download
1 / 24
240 likes | 336 Views
Full Mission Simulation Report. Temple University Fred Avery, Gene Council, Ny’Jaa Bobo , Salvatore Giorgi, Jay Shukla 4 /21/12. Mission Overview. Measure the earth’s magnetic field as a function of altitude Measure flight dynamics of the rocket

E N D
Full Mission Simulation Report Temple University Fred Avery, Gene Council, Ny’JaaBobo, Salvatore Giorgi, Jay Shukla 4/21/12
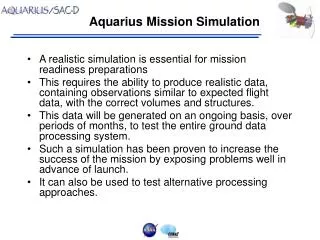
Mission Overview • Measure the earth’s magnetic field as a function of altitude • Measure flight dynamics of the rocket • Capture biological samples in the atmosphere • Identify types and concentration of samples as function of altitude • Measure UV intensity as function of altitude • Identify UV damaged DNA in samples Figure: A UV radiation induced thymine-thymine cyclobutane dimer (right) is the type of DNA damage which is undone by photolyase.
Mission Overview Current Problems • Fully integrated payload is still not complete • Not able to get plates cut • Standoffs ordered but not delivered • Magnetometer is still not functioning with microprocessor • Looked into other models, but all cheap sensors require I2C protocol, which seems to be where the problem is • Decoding the spectrometer data • Spectrometer uses data compression when transmitting data • Currently working on method to decode the compression • In the end, this is not needed as we have enough memory to store uncompressed data
Mission Overview - Testing Tests Previously Completed • Filtration System Temperature Tests • Filtration System Pressure Tests • Data Collection • Power • Spin • Plate Stress/Strain Simulations
Mission Overview - Testing New Tests Completed • Additional Power Tests • Additional Data Collection Tests • Standoff Simulations • Deflection • Stress • Loading • Spectrometer Integration Time • New Center of Gravity Simulations • System Activation
Subsystem Overview - Mechanical • No changes have been made to this subsystem since last report • Filter system consists of four filter holders, one manifold and four servo motors • Servos are mounted to top of manifold and control the air flow to the filter holders.
Subsystem Overview - Electrical • No official changes have been made to this subsystem since last report • Electrical system consists of one microprocessor, two accelerometers, magnetometer, gyroscope, and a spectrometer • The magnetometer will be mounted on the top plate while the remaining item will be located on the bottom plate
Subsystem Overview - Power • No changes have been made to this subsystem since last report • A total of 3 batteries will be used to power the system • All sensors will be powered by microprocessors • System activation will be done with a RBF pin
Mechanical - Structure Standoffs • Size: 5/16” Hex Size, 8-32 Screw Size, 2” length • Same type and size as Drexel’s though ours are made of steel Plate Problems • Laser Cutter will now be used to machine plates • Makrolon (Polycarbonate) cannot be laser cut • Acrylic will now be used in co ordinance with Drexel’s payload
Mechanical - Structure Center of Gravity • X = 1.00 in • Y = 0.91 in • Z = 0.94 in Current Weight • 6.04 lbs • Approximately 3 lbs per plate • Steel blocks (~1 in3) will be used to add weight (~1 lb each)
Mechanical - Standoffs • Deflection Simulation • As a worst case scenario, wind gusts may affect structure and standoffs could be affected • The maximum force expectancy during flight is about 3380 N • Standoffs will deform about 0.5 mm (~0.02 in) if at all • Color represents severity and value of deformation (Red being maximum, blue being minimum) • The most deformation will occur in the center of standoff due to the fixed ends
Mechanical - Standoffs • Shearing Simulation • A force of 3380 N in each axis may affect the payload structure • This force will not highly affect the standoffs being used • Only a moderate amount of stress will result from the force expected and will not exceed material strength • The fixed ends cause standoffs to deflect
Mechanical - Standoffs • Total mass of canister is 9.07 kg • Max loading expected during flight is 38 g • Total force acting on standoff is 9.07 kg*38*9.81m/s2 = 3380 N • Stress expectancy during flight is 74,700 Pa • Standoff strength is 5.14×10⁸Pa • Expected Stress will not exceed Standoff Strength • Material is able to withstand the force expectancy
Mechanical– Filter System • Fully constructed • Processor is programmed with all timing information • Batteries proven to power system • Fully functional during previous temperature tests • Plan to further minimize leak with high vacuum grease • Grease will not contaminate filters • Need to wait until end of semester to get access to vacuum pump (first week of May)
Electrical – System Activation • Previously changed from g-switch to timer activation • We use a delay command • Designed software so that we change constant parameter minute to change the activation time • This will give us more flexibility in the event our activation time changes before launch • delay command in arduino delays the program by a specified time in milliseconds • Example: • delay(minute*60*1000) • Parameter is unsigned integer, which must be less than 232
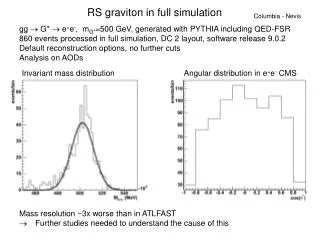
Electrical - Spectrometer • Higher integration time may saturate data • Low integration time will not give relevant data • Canister spins at 5.6 rev/sec and thus field of view passes over the sun at least 5 times per sec • Graph above shows spectrum with various integration times on sunny day with fiber optics cable pointed directly at sun
Electrical - Spectrometer • Above graph shows spectrum with varying on a very overcast day with fiber optics cable pointed away from sun • Will do further testing in Chemistry department to determine integration time needed • Tests will using laser pulses to simulate optical port facing sun while spinning
Power (EPS) • Above table shows voltage values for 30 minute flight simulation • Batteries were able to power everything, as expected
Software • Data collected for 30 minute flight is 1.4 MB with spectrometer included • Problems • Software still not working for magnetometer and pic32 board • Software not able to run through multiple spectrometer integration times while sampling other sensors
Action Item Summary Week 1 • Cut plates (or at minimum, schedule time with Drexel for cutting) • Purchase drop down tubing and fittings • Detailed full canister integration procedure Week 2 • Full canister center of gravity simulations • Finalize spectrometer integration time • Test vacuum grease • Finalize all sensor problems
Action Item Summary Week 3 • Have entire canister constructed • Fully integrated with Drexel • Drop down tubing integration completed sorted Week 4 • Complete all Launch Readiness tests
Conclusions • Besides being physically connected we feel as though our system is very close to being launch ready • Focus will be on working with other teams to get the full canister ready for launch • With end of semester next week, all team members will be able to give this project their full attention