Download
1 / 29
300 likes | 414 Views
Projecting Future Mortality Using Information on Health Behaviors. David M. Cutler, Edward L. Glaeser, and Allison B. Rosen. Questions. Is the US population healthier than in the past? Yes: Smoking has declined greatly No: We are more obese Yes: We treat disease better

E N D
Projecting Future Mortality Using Information on Health Behaviors David M. Cutler, Edward L. Glaeser, and Allison B. Rosen
Questions • Is the US population healthier than in the past? • Yes: Smoking has declined greatly • No: We are more obese • Yes: We treat disease better • Will these trends continue?
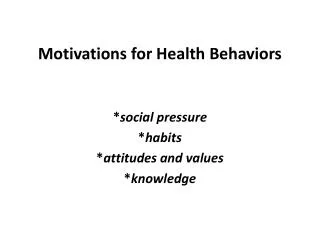
Restrictions • We focus on health behaviors. • Smoking • Drinking • Weight • Taking medications
Actual Causes of Death in the United States, 2004 • Tobacco 18% • Obesity 15% • Alcohol 4% • Microbial agents 3% • Toxic agents 2% • MVAs 2% • Guns 1% • Sexual behaviors 1% • Illicit use of drugs 1% Source: Mokdad et al., 2004.
Methodology • Relate risk factors to subsequent mortality • NHANES I data (1971-75) linked to subsequent mortality • Evaluate change in risk factors, 1971-75 vs. 1999-2002 • Consider forecasts about risk factors in the future.
Data • NHANES I (1971-75) and NHANES 1999-2002 • Population 25-74 and 55-74 • Demographics • Self reported smoking, alcohol • Physical measures of BP, cholesterol, BMI
Rough relationships Demographics Risk: BP, Cholesterol Mortality weight Behaviors smoking
Mortality Equation: 10 year mortality as a function of… • Age/sex (10 year age x sex) • Race (white/black/other) • Education (<HS, HS, Some College, College+) • Smoker (current/former/never) • BMI (low, normal, overweight, obese) • Alcohol (heavy, light, never) • Blood pressure (normal, pre-HTN, Stage 1, Stage 2) • Cholesterol (low, borderline, high)
Summary Statistics:Education NHANES I NHANES 1999-2002
Summary Statistics:Smoking NHANES I NHANES 1999-2002
Summary Statistics:Drinking NHANES I NHANES 1999-2002
Summary Statistics:BMI NHANES I NHANES 1999-2002
Summary Statistics:Hypertension NHANES I NHANES 1999-2002
Summary Statistics:High Cholesterol NHANES I NHANES 1999-2002
Forecasts • Simulate 20 years from now • Not totally clear what explains these behaviors. • Smoking: Taxes (a bit); Beliefs; Peer effects • Obesity: Lower (time) price of food • Assume these are still playing out
Forecasts • Smoking • Know ever smoking for many cohorts (guess for others) • Assume trend reduction in current smoking continues • Smoking rate falls from 25% to 15%
Forecast Assumptions • Drinking • Continued reduction in heavy and light drinking • BMI • Same change in BMI over past 20 years as previous 20 years • Increase of about 10 lbs.
Implications of higher BMI: BP and Cholesterol • Use 1959-62 NHANES to relate BP and cholesterol to obesity • Essentially no treatment • Predict BP and cholesterol 20 years hence • Includes random error term • Assume same share of people treated and same impact of treatment • Draw BP and cholesterol from distribution among treated.
Impact of 10% reduction in mortality on expected age at death for people alive at age 0.5 years 0.9 years 1.2 years 1.1 years
Results • Impact of continued increase in obesity could be enormous. • Key is risk factor control • Get more people treated • Improve effectiveness of therapy – better drugs, and taken more regularly
Qualifications • Impact on mortality is not necessarily the same as impact on disability • Important for DI and Medicare/Medicaid forecasts