Download
1 / 1
30 likes | 168 Views
Blow up.

E N D
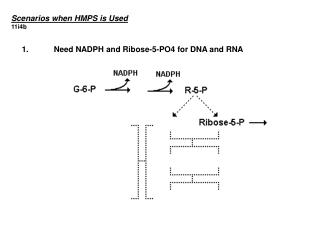
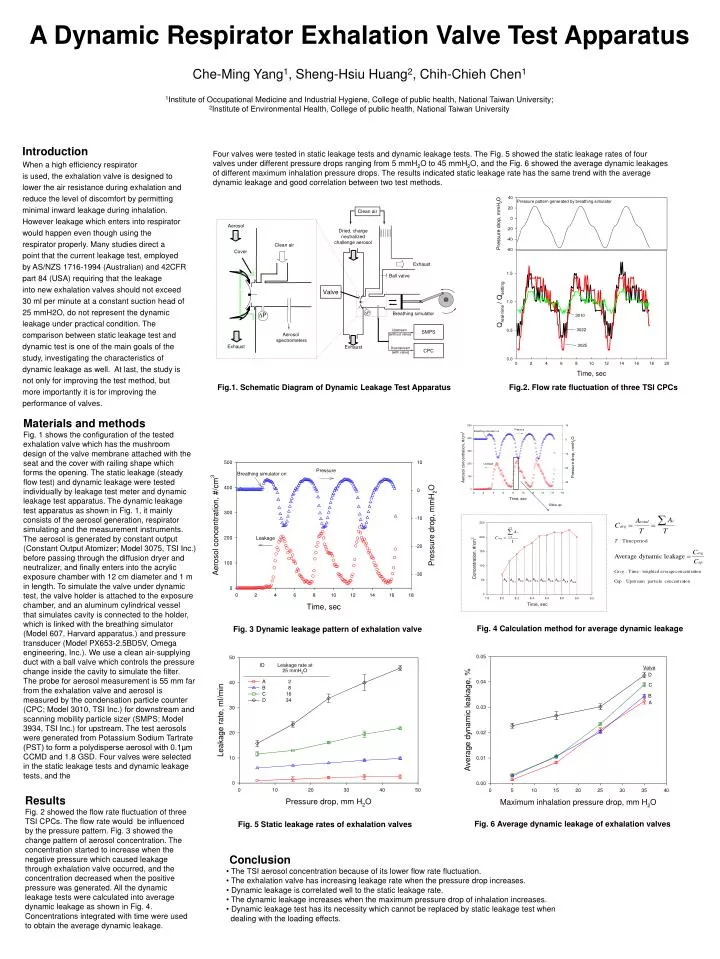
Blow up A Dynamic Respirator Exhalation Valve Test Apparatus Che-Ming Yang1, Sheng-Hsiu Huang2, Chih-Chieh Chen11Institute of Occupational Medicine and Industrial Hygiene, College of public health, National Taiwan University;2Institute of Environmental Health, College of public health, National Taiwan University Four valves were tested in static leakage tests and dynamic leakage tests. The Fig. 5 showed the static leakage rates of four valves under different pressure drops ranging from 5 mmH2O to 45 mmH2O, and the Fig. 6 showed the average dynamic leakages of different maximum inhalation pressure drops. The results indicated static leakage rate has the same trend with the average dynamic leakage and good correlation between two test methods. Introduction When a high efficiency respirator is used, the exhalation valve is designed to lower the air resistance during exhalation and reduce the level of discomfort by permitting minimal inward leakage during inhalation. However leakage which enters into respirator would happen even though using the respirator properly. Many studies direct a point that the current leakage test, employed by AS/NZS 1716-1994 (Australian) and 42CFR part 84 (USA) requiring that the leakage into new exhalation valves should not exceed 30 ml per minute at a constant suction head of 25 mmH2O, do not represent the dynamic leakage under practical condition. The comparison between static leakage test and dynamic test is one of the main goals of the study, investigating the characteristics of dynamic leakage as well. At last, the study is not only for improving the test method, but more importantly it is for improving the performance of valves. Fig.1. Schematic Diagram of Dynamic Leakage Test Apparatus Fig.2. Flow rate fluctuation of three TSI CPCs Materials and methods Fig. 1 shows the configuration of the tested exhalation valve which has the mushroom design of the valve membrane attached with the seat and the cover with railing shape which forms the opening. The static leakage (steady flow test) and dynamic leakage were tested individually by leakage test meter and dynamic leakage test apparatus. The dynamic leakage test apparatus as shown in Fig. 1, it mainly consists of the aerosol generation, respirator simulating and the measurement instruments. The aerosol is generated by constant output (Constant Output Atomizer; Model 3075, TSI Inc.) before passing through the diffusion dryer and neutralizer, and finally enters into the acrylic exposure chamber with 12 cm diameter and 1 m in length. To simulate the valve under dynamic test, the valve holder is attached to the exposure chamber, and an aluminum cylindrical vessel that simulates cavity is connected to the holder, which is linked with the breathing simulator (Model 607, Harvard apparatus.) and pressure transducer (Model PX653-2.5BD5V, Omega engineering, Inc.). We use a clean air-supplying duct with a ball valve which controls the pressure change inside the cavity to simulate the filter. The probe for aerosol measurement is 55 mm far from the exhalation valve and aerosol is measured by the condensation particle counter (CPC; Model 3010, TSI Inc.) for downstream and scanning mobility particle sizer (SMPS; Model 3934, TSI Inc.) for upstream. The test aerosols were generated from Potassium Sodium Tartrate (PST) to form a polydisperse aerosol with 0.1μm CCMD and 1.8 GSD. Four valves were selected in the static leakage tests and dynamic leakage tests, and the Fig. 4 Calculation method for average dynamic leakage Fig. 3 Dynamic leakage pattern of exhalation valve Results Fig. 2 showed the flow rate fluctuation of three TSI CPCs. The flow rate would be influenced by the pressure pattern. Fig. 3 showed the change pattern of aerosol concentration. The concentration started to increase when the negative pressure which caused leakage through exhalation valve occurred, and the concentration decreased when the positive pressure was generated. All the dynamic leakage tests were calculated into average dynamic leakage as shown in Fig. 4. Concentrations integrated with time were used to obtain the average dynamic leakage. Fig. 6 Average dynamic leakage of exhalation valves Fig. 5 Static leakage rates of exhalation valves • Conclusion • The TSI aerosol concentration because of its lower flow rate fluctuation. • The exhalation valve has increasing leakage rate when the pressure drop increases. • Dynamic leakage is correlated well to the static leakage rate. • The dynamic leakage increases when the maximum pressure drop of inhalation increases. • Dynamic leakage test has its necessity which cannot be replaced by static leakage test when • dealing with the loading effects.