Download
1 / 23
230 likes | 363 Views
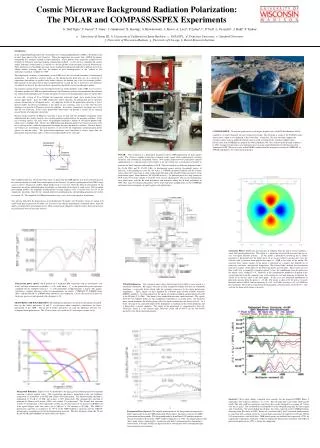
The Polar Fields Seen in 17 GHz Microwave Flux. Leif Svalgaard Stanford University 18 November, 2011. Nobeyama Radioheliograph. Image of 17GHz Emission, beam width 5”. ν 17 GHz = λ 1.76 cm ν e = B (Tesla) · 28 GHz 17 GHz is 3 rd harmonic ν e for 2000 G. General Limb brightening

E N D
The Polar Fields Seen in 17 GHz Microwave Flux Leif Svalgaard Stanford University 18 November, 2011
Image of 17GHz Emission, beam width 5” ν17 GHz = λ1.76 cm νe = B (Tesla) · 28 GHz 17 GHz is 3rd harmonic νe for 2000 G • General Limb brightening • Active regions bright • Gyro-resonance is thought (?) to result as 3rd harmonic of 2000 G • Also Bremsstralung from hot atmosphere [10,000 – 13,000 K]
Bright Patches in Polar Regions “One still unresolved puzzle about the chromosphere is why at some frequencies (at least 10-100 GHz) the polar coronal holes appear brighter than the rest of the quiet Sun. There is some evidence that all coronal holes, even those not at the poles, are brighter” http://web.njit.edu/~gary/728/ Lectures 10 & 11 “still-mysterious polar brightenings” Bastian et al. (1998, FASR) Polar regions at brightness temperature 10,000 and 13,000 K. (333 K between contour lines). Bright Patches Mark Strong Magnetic Fields (?)
Magnetic Flux in the Polar Caps “magnetic flux of the radial field component in the latitude zones from 78° to 88 ° in N (dash and dots line) and S hemispheres (dash line) is ~constant”. Elena B. Average flux above 55°; North is now getting weaker than South. Question: At solar maximum, are the polar caps, when reversing field, covered with equal amounts of opposite polarity magnetic fluxes or isn’t there any flux?
Not More Bright Patches at Solar Maximum, 2000 Only a few scatted, weak patches. So no magnetic flux of the kind that makes patches [~2000 G], thus the polar fields are not an equal mixture of opposite polarities. There aren’t any. What does WSO measure? Not the ‘pepper and salt’
But at Solar Minimum, Oh Boy! Rotate and long-lived
Here is what a synoptic map of the 17 GHz radiation looks like at minimum
Coronal Holes everywhere show same behavior as the polar holes
Another Example of Coronal Hole at Limb Filament I think we can learn about the polar patches by studying low-latitude coronal holes
Quantifying the Brightening Compute average brightness temperature in ring of constant width just inside the limb
Annual [B0] Modulation Monthly Means Two curves: East and West half This shows that the brightening is not just general limb brightening, but is concentrated at the pole just as the polar magnetic field (is thus due to the field?)
17 GHz Updated through 2010 North polar cap Daily Values Caius Selhorst South polar cap Selhorst, Caius L., Svalgaard, L., Giménez de Castro, C. G., Válio, A., Costa, J. E. R., Shibasaki, K.; IAU286, 2011
Excess Tb over 10,800K, signed according to WSO polar field sign
Strong Rotational Modulation Daily Means Strong Rotational Signal = Longitudinal Structure
So what are those bright patches? 2:44 UT 17 GHz I don’t see any clear match ups Shimojo & Tsuneta, Ap, 2009 The magnetic concentrations have magnetic polarity opposite to that of kG-patches. Our results suggest that the coronal activities and structures in the polar coronal hole can be used as a tracer of the appearance of the minority (?) polarities in the polar region”. Shimojo & Tsuneta, Ap, 2009
“Tsuneta et al. (ApJ, 2008) found many vertically oriented magnetic flux tubes with field strength as strong as 1 ∼ 1.2kG are scattered in latitude between 70° and 90°and all the fluxes have the same sign consistent with the global polar field. If the flux tubes extend to the interplanetary space, there will be a possibility that they serve as the guide fields for X-ray jets, coronal plumes, and the fast solar wind”.
So, Look for this in HMI data I don’t see anything that would match in the LOS field. Wrong contour level choice? But perhaps the LOS will not show the field as it is transverse…
But AIA then? No strong concentrations match. Perhaps there is a faint glow at the right places… AIA 304 211 171 We must remember that the 17 GHz flux in question has a brightness temperature of 10,000-13,000 K, so does not come from the hot corona, but I would have expected some signature of the flux somewhere. We should look for such.
? The end