Download
1 / 40
400 likes | 404 Views
Food Webs in the Ocean. Andrew W Trites Marine Mammal Research Unit University of British Columbia. Who eats whom and how much?. Steller Sea Lions. Diet: Stomachs. Diet: Scats. Diet: Scats. Diet: Scats. Fatty acids Stable Isotopes. Bering Sea Food Web. Bering Sea Food Web.

E N D
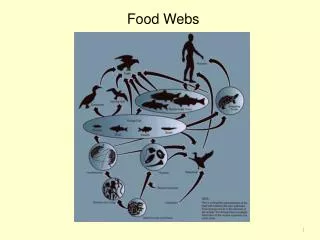
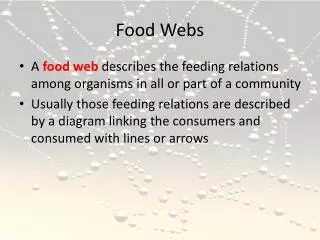
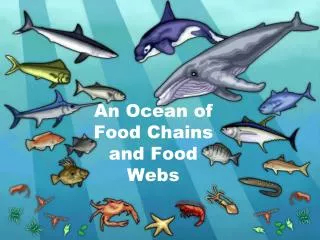
Food Webs in the Ocean Andrew W Trites Marine Mammal Research Unit University of British Columbia Who eats whom and how much?
Diet: Scats Fatty acids Stable Isotopes
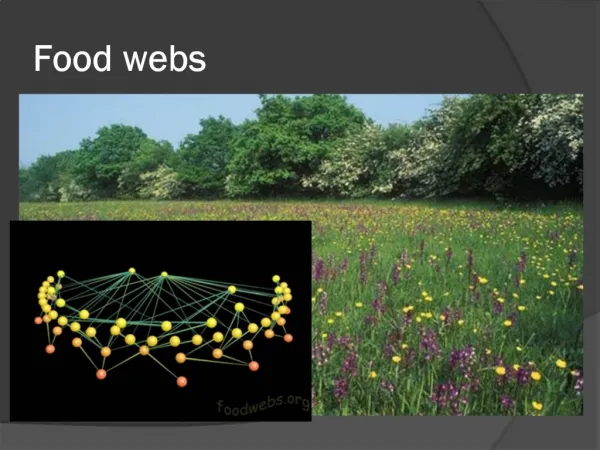
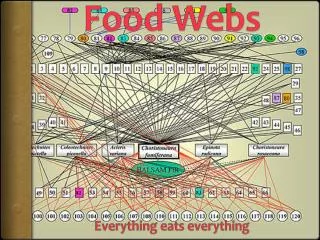
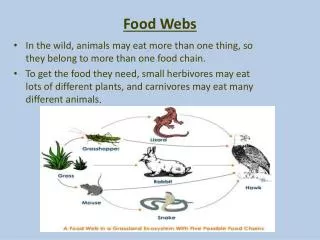
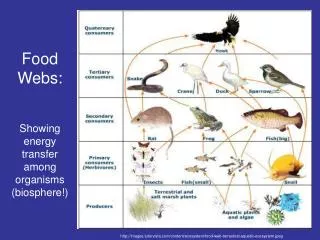
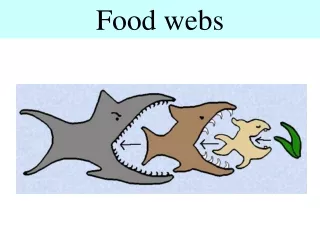
Food Web Patterns (Species) • Sizes • larger at higher trophic levels • Numbers • more at the bottom of food webs • Proportions • constant at each trophic level • Diets • most are restricted – sizes & levels • humans can eat all
Food Web Patterns (Chain Lengths) • Typically short (2-5 linkages) • Oceanic upwelling (2.2-2.8) • Coastal shelves (2.8-4.0) • Tropical estuaries (3.0-5.0) • Function of • Environmental stability • Energy transfer efficiency
Estimating Energy Requirements • Stomach contents • Feeding rates • Metabolism • Mathematical models • single species • multispecies (ecosystem)
Studies • Captive • Field • Models
Food Web Patterns • 10% trophic transfer efficiency • Consumption • young > old • not constant over time • quality of prey changes
Food Web Patterns(Fisheries) • High fish catches associated with • high primary production • fishing at lower trophic levels • Potential concerns • may break long food chains • may affect ecosystem stability
Food Web Patterns(Steller sea lions) • Diet studies • Single species modeling • Ecosystem modeling • Captive feeding trials • Predation
Diet Studies • 1950s 1990s • Shifted from fatty fishes to low fat fishes
Single Species Modeling • Low diversity • Higher cost to young
Captive Feeding Trials • Require 35-80% more pollock than herring
Food Web Analysis (Steller Sea Lions) • Composition of North Pacific has changed • Diet has changed • Diet and ecosystem composition are consistent • Health consequences of eating too many gadids • Carrying capacity of pinnipeds is lower • Recovery linked to a more diverse diet & reduced predation • Environment appears to be the driving force
Conclusions • Food webs & consumption estimates essential for fisheries management & understanding ecosystem dynamics • Require a combination of field studies, captive studies and models • Key to understanding what our marine ecosystems once were, what they are currently, and what they might be in the future