Download

1 / 56
560 likes | 651 Views
Alternatives to Randomized Trials for Estimating Treatment Efficacy (or Harm). Thomas B. Newman, MD, MPH Professor of Epidemiology and Biostatistics and Pediatrics, UCSF. AltToRcts11Nov09. Lecture Outline. Announcements Background Instrumental variables and natural experiments

E N D
Alternatives to Randomized Trials for Estimating Treatment Efficacy (or Harm) Thomas B. Newman, MD, MPH Professor of Epidemiology and Biostatistics and Pediatrics, UCSF AltToRcts11Nov09
Lecture Outline • Announcements • Background • Instrumental variables and natural experiments • Measuring alternate variables to estimate bias • Propensity scores • Practice problems
Announcements • Marketing Medicines with Research video • Exam question contest: questions due Monday, 11/23 by e-mail to TN • Real examples only, recent articles strongly preferred • Include answer • We may change it • Take-home final will be handed out 12/3, discussed in lecture 12/10
Background • Why do randomized trials? • Assemble comparable groups (avoid confounding) • Allow blinding (to avoid placebo effect, cointerventions, and bias in measuring outcome variable) • Observational studies • May be able to assemble comparable groups or use statistical adjustment • Won’t be blinded
Why is it hard to assemble comparable groups without randomizing? • People who get treated differ from those who don’t • Important differences are with respect risk of the outcome • Treated people often at higher risk (confounding by indication for treatment). • Treated people may be at lower risk (selection bias)
Pre-test • “Observational studies can never establish causation. Proof of causation requires randomized trials.” • How many have heard this? • How many agree?
Do you believe there is a causal relationship between… • Acetaminophen overdose or mushroom poisoning and liver failure? • Wearing glasses for refractive errors and improved vision? • Infiltrate of IV calcium infusion and skin sloughing? • Receipt of fluids and recovery from dehydration? • Land mine explosions and limb injuries?
When is causal inference from observational studies easy? • Outcomes • notrelated to indications for treatment • rarely if ever occurs spontaneously • highly localized in time or space • Treatment • well-understood biologically • very rapidly acting
When it’s hard: • Outcomes are related to indications or selection for treatment, are delayed, non specific, or not well understood • Learning disabilities in children treated with anticonvulsants • Suicide in users of antidepressants • Long-term mortality after surgery for gastroesophageal reflux in handicapped children
Natural Experiments and Instrumental Variables • Natural experiments: Find a times or places when/where receipt of treatment was unlikely to be related to prognosis/risk of outcome (except through known covariates) • E.g., time-series analyses where something changed (e.g. new intervention became available) • Instrumental variables (IV): measurable factors that influence probability oftreatment (or exposure to the factor of interest) that are not otherwise associated with outcome
Use of large databases • Allows use of (weak) surrogate measures for actual predictor • Biased towards null • Achieve statistical significance with large sample size • Algebraically reverse bias towards null (with various assumptions)
Delayed Effects of the Military Draft on Mortality • Origin of study: Agent Orange concern • Design: “Randomized natural experiment” using the draft lottery • Data source: computerized death certificate registries, CA and PA • Predictor variable of interest: military service Hearst N, Newman TB, Hulley SB. NEJM 1986; 314:620-24
Why not compare outcomes according to the predictor variable of interest? • Biased comparison – those who serve in the military start out healthier • “Healthy warrior effect”
Delayed Effects of the Military Draft on Mortality • The instrumental variablemeasured: draft lottery number below cutoff (based on date of birth) • IV associated with predictor variable of interest, not independently associated with outcome
BUT: Having an eligible number was a poor measure of military service:
RCT as an Instrumental Variable: Health effects of exclusive breast feeding • Can’t do RCT of exclusive breast-feeding • Can do RCT of breast-feeding PROMOTION • Assignment to BF promotion group should be associated with exclusive breast feeding, but not independently associated with outcome • Need very large sample size • Algebraic correction
Promotion of Breastfeeding Intervention Trial (PROBIT) • Cluster-randomized trial at 31 sites in Belarus • Subjects 17,046 term singleton infants with birth weight > 2500 g, initially breastfed • Intervention: WHO/UNICEF “Baby Friendly Hospital Initiative” • Outcomes: • Breastfeeding at 3,6,9,12 months • Allergic, gastrointestinal and respiratory disease • F/U to 12 months on 16,491 (96.7%) Kramer MS, et al. JAMA 2001;285:413-20.
PROBIT, RQ #1 • Does a “Baby Friendly Hospital” increase exclusive breastfeeding? • Predictor = Group assignment • Outcome = Exclusive breast feeding • Intention-to-treat (ITT) analysis is fine • Exclusive BF at 3 months (rounded) 40% vs 5%; P < 0.001
Probit RQ #2 • Does exclusive breastfeeding reduce the risk of eczema in the infant? • If the only effect of intervention related to eczema is increasing exclusive BF, then • Predictor = Group assignment • Outcome = Eczema • ITT analysis: biased towards null; informative mainly if study positive • Eczema risk 3.3% vs 6.3%; adjusted OR = 0.54 (95% CI 0.31-.95 based on GLIMMIX; P = 0.03)
PROBIT, RQ #3 • How much does exclusive breastfeeding reduce the risk of eczema in the infant? (What is the NNEBF*? ) • Predictor = Group assignment • Outcome = Eczema • ITT won’t work -- too much misclassification. (Gives the number needed to be exposed to the intervention, not the NNEBF.) *Number Needed to Exclusively Breast Feed
Algebraic correction • If all of the difference in eczema is due to the difference in exclusive breast feeding, it can be shown that the ARR is: • In other words, the observed risk difference is divided by the difference in proportions exposed to the treatment of interest.
NNEBF and caveat • Since ARR = 8.6%, NNEBF to prevent 1 case of eczema is about 1/.086 = 12 • Caveats: • Results are for the effect of breastfeeding in response to the intervention • Assumes the only effect of the Baby Friendly Hospital is via difference in exclusive breastfeeding • Similarly, effects of draft lottery only apply to those who served as a result of the lottery.
Summary/other examples • If variables known NOT to be associated with outcome are associated with treatment of interest, consider this approach. • Generalizes to many “natural experiments.” • E.g., an intervention is intermittently available, or only available to certain groups. -- different outcome by day of the week, etc.
More natural experiments: • Costs of discontinuity of care: increased laboratory test ordering in patients transferred to a different team the next morning* • Effect of increased ED copayment: decrease in ED visits without an increase in hospitalizations or ICU admissions** • Aircraft cabin air recirculation and symptoms of the common cold: no difference by type of air recirculation in aircraft *** * Lofgren, RO. J Gen Intern Med. 1990;5:501-5 **Hsu J, et al. Health Services Research 2006;41:1801-20 *** Zitter JN et al. JAMA 2002;288:483-6
Alternate variables to estimate bias or confounding • Measure an outcome that WOULD be affected by bias, but not by treatment of interest (and see if it is) • Measure a predictor that WOULD cause the same bias as the predictor of interest (and see if it does)
Alternate outcome: Observational study of screening sigmoidoscopy • Possible bias: patients who agree to sigmoidoscopy are likely to be different • Solution: measure an outcome that would be similarly affected by bias • Results: • Decreased deaths from cancers within the reach of the sigmoidoscope (OR= 0.41) • No effect on deaths from more proximal cancers (OR= 0.96). Selby et al, NEJM 1992;326:653-7
Alternate outcome: Effect of British “breathalyser” crackdown • Abrupt drop in accidents occurring during weekend nights (when pubs are open) • Measure an outcome that would be affected by bias: accidents during other times • Result: No change in accidents occurring during other hours See Cook and Campbell: Quasi-Experimentation.Boston:Houghton Mifflin, p. 219
Alternate predictor: Calcium Channel Blockers (CCB) and Acute Myocardial Infarction (AMI) • Population based case-control study at Group Health • Progressive increase in risk of AMI with higher doses of CCB (P <0.01) • Concern: confounding by indication • Measure an alternate predictor that would cause same bias: beta-blockers: • Result: progressive decrease in risk associated with higher doses of beta-blockers (P =0.04) Psaty et al., JAMA 1995;274:620-25
Suicide Risk in Bipolar Disorder During Treatment With Lithium and Divalproex • Retrospective cohort study of Kaiser Permanente and Group Health patients with bipolar disorder • Compared with no treatment, patients treated with Valproex at 2.1 times suicide risk • Concern: confounding by indication • Results: Suicides per 1000 person/years • 31.3 for treatment with divalproex • 15 for no treatment (P<0.001) • 10.8 for Lithium (P<0.001) • If confounding by indication, expect same bias for Lithium Goodwin et al. JAMA. 2003;290:1467-1473
Initial Mood Stabilizer Prescription by Year of Initial Diagnosis Goodwin et al. JAMA. 2003;290:1467-1473
Estimating biases: Cautionary Tale • Nurses’ Health Study • Vitamin E assoc. with decreased risk of CHD (RR ~0.6) • No significant effect of multiple vitamins • Health Professionals Study • Vitamin E assoc. with decreased risk of CHD (RR ~0.6) • No significant effect of Vitamin C • TN began taking Vitamin E * N Engl J Med. 1993;328:1444-9 and 1450-6
Meta-analysis: high-dosage vitamin E supplementation may increase all-cause mortality Miller ER et al. Ann Intern Med. 2005 Jan 4;142(1):37-46
Propensity Scores -1 Big picture: want to know if association between treatment and outcome is CAUSAL Recall competing explanation = confounding by indication for treatment: Factor must be associated with outcome Factor must be associated with treatment Traditional approach: adjust for factors associated with outcome
Propensity Scores -2 Alternative approach: Create a new variable, propensity to be treated with the intervention Then match, stratify, or include it in multivariable analyses Advantages: Better power to control for covariables (because receipt of the intervention may be much more common than occurrence of the outcome) You can more easily tell when treated and untreated groups are not comparable
Propensity to receive treatment Propensity to receive treatment Propensity to receive treatment 1 1 1 C 0 0 0 Treated Treated Not Treated Not Treated Treated Not Treated www.chrp.org How Much Overlap In The Propensity Scores Do We Want? A B
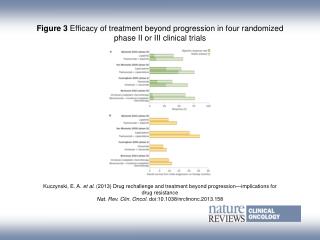
Example: Aspirin use and all-cause mortality among patients being evaluated for known or suspected Coronary Artery Disease RQ: Does aspirin reduce all-cause mortality in patients with coronary disease Design: Cohort study Subjects: 6174 consecutive patients getting stress echocardiograms Predictor: Aspirin use Outcome: All-cause mortality Crude result: 4.5% mortality in each group Gum PA et al. JAMA 2001; 286: 1187-94
Analysis using Propensity Scores Two multivariable analyses: Predictors of aspirin use Predictors of death Predictors of ASA use turned into a propensity score Users and non-users of ASA matched on ASA propensity score Compare mortality in matched groups (Unmatched patients cannot be analyzed)
Survival in Propensity-Matched Patients Recall total N=6174
Propensity score limitations • Can only compare subjects whose propensity scores overlap • Can only generalize to subjects who could have received either treatment • Limitations similar to exclusions from clinical trials • Important variables may be missing from your model
Propensity score question • Are there examples where: • 1. Propensity score analyses gave substantially different results from traditional multivariate methods (e.g. logistic regression) and • 2. The propensity score answer was closer to the right answer? • TN is still looking!
Problem 10.1 • RQ: Do small doses of mercury in thimerosal cause autism? • Data source: electronic data from a large HMO (very high N) • Opportunity: • Rhogam (Rh Immune Globulin) is given to Rh-negative women during pregnancy (if they get good prenatal care • It had 25 mcg of Hg per dose until 2001 • You have data from an electronic record 1990 to the present with blood types, Rhogam, diagnoses of autism • Assume: • You are interested in effects of 25 mcg of Hg • The incidence of autism has been increasing • How would you design your study? • What groups would you compare?
Problem 10.5 • Does perioperative use of lipid-lowering drugs decrease mortality following cardiac surgery?
Efficacy of Inpatient Phototherapy in Jaundiced Newborns: Comparison of Multiple Logistic Regression, Propensity Score, and Instrumental Variable Estimates Thomas B. Newman, MD, MPH Charles E. McCulloch, PhD Michael W. Kuzniewicz, MD,MPH Gabriel J. Escobar, MD Departments of Epidemiology and Biostatistics and Pediatrics, UCSF Division of Research, Northern California Kaiser Permanente Funding: NICHD R01 HD047557
Background • 2/3 of newborns develop jaundice • 5-10% treated with phototherapy • Current treatment thresholds higher and PT units more intense than used in previous RCTs • No RCTs of PT as currently recommended
Background: AAP 2004 guidelines • Photo-therapy • Exchange transfusion
Methods • Retrospective cohort study • Subjects • ≥ 2000 g, ≥ 35 wks born 1995-2004 in Northern CA Kaiser hospitals (N=281,898) • Qualifying total serum bilirubin (TSB) level ± 3 mg/dL from AAP phototherapy threshold (PTT) (N=22,547) • Excluded if Direct Antiglobulin Test positive (N=1816) • N = 20,731
Qualifying TSB levels and key confounder TSB - PTT = + 3 mg/dL TSB - PTT = -2 mg/dL