Download
1 / 52
520 likes | 624 Views
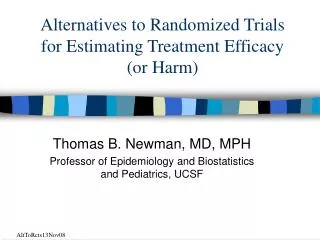
Elegant Alternatives to Randomized Trials for Determining Treatment Efficacy (or Harm). Thomas B. Newman, MD, MPH Professor of Epidemiology and Biostatistics and Pediatrics, UCSF. PASAltToRCTs forPAS 11May05.ppt. Lecture Outline. Background Instrumental variables and natural experiments

E N D
Elegant Alternatives to Randomized Trials for Determining Treatment Efficacy (or Harm) Thomas B. Newman, MD, MPH Professor of Epidemiology and Biostatistics and Pediatrics, UCSF \PAS\AltToRCTs forPAS 11May05.ppt
Lecture Outline • Background • Instrumental variables and natural experiments • Measuring additional unrelated variables to estimate bias • Propensity scores • Illustrations using phototherapy for jaundice
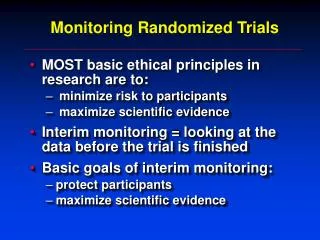
Background • Why do RCTs? • Assemble comparable groups (avoid confounding) • Allow blinding (to avoid placebo effect, cointerventions, and bias in measuring outcome variable) • Observational studies • May be able to assemble comparable groups or use statistical adjustment • Won’t be blinded
Why is it hard to assemble comparable groups without randomizing? • People who get treated differ from those who don’t • Important differences are with respect risk of the outcome • Treated people often at higher risk (confounding by indication for treatment). • Treated people may be at lower risk (selection bias)
Pre-test • “Observational studies can never establish causation. Proof of causality requires randomized trials.” • True or false? • FALSE
When causal inference from observational studies is easy • Outcomes not related to indications for treatment, are highly localized in time or space, or well-understood biologically • Liver failure following acetaminophen overdose • Fluids for dehydration • Skin sloughing after infiltrate of calcium infusion • Birth defects from isotretinoin • Land mines and limb injuries
Post-test • “Observational studies can never establish causation. Proof of causality requires randomized trials.” • True or false? • FALSE
When it’s hard: • Outcomes are related to indications or selection for treatment • Learning disabilities in children treated with anticonvulsants • Suicide in users of antidepressants • Mortality after surgery for gastroesophageal reflux in children
Natural Experiments and Instrumental Variables • Find a time or place where receipt of treatment was unlikely to be related to prognosis • E.g., time-series analyses where something changed (e.g. new intervention became available) • Instrumental variables (IV): measurable factors that influence probability oftreatment that are not otherwise associated with outcome
Use of large databases • Allows use of (weak) surrogate measures for actual predictor • Biased towards null • Achieve statistical significance with large sample size • Algebraically reverse bias towards null (with various assumptions)
Delayed Effects of the Military Draft on Mortality • Origin of study: Agent Orange concern • Design: “Randomized natural experiment”using the draft lottery • Data source: computerized death certificate registries, CA and PA • Predictor variable of interest: military service Hearst N, Newman TB, Hulley SB. NEJM 1986; 314:620-24
Why not compare outcomes according to the predictor variable of interest? • Biased comparison – those who serve in the military start out healthier • “Healthy warrior effect”
Delayed Effects of the Military Draft on Mortality • The instrumental variablemeasured: draft lottery number below cutoff (based on date of birth) • IV associated with predictor variable of interest, not independently associated with outcome
BUT: Having an eligible number was a poor measure of military service:
Algebraic Correction 1: • Assume death rates in eligible (RI) and ineligible (RC) men are weighted averages of rates among those serving (A) and not serving (B) • Then if p1 and p2 are proportions serving in the eligible and not eligible groups, Ri and Rc are:RI = p1A + (1-p1)B RC= p2A + (1-p2)B
Algebraic correction 2: • What we want to know is the relative risk for military service (A/B) • What we have is the relative risk for draft eligibility (RI/RC) • Then with algebra it can be shown that :A/B = 1-RI/RC + 1 p2RI/RC -p1
Health effects of breast feeding • Can’t do RCT of breast-feeding • Can do RCT of breast-feeding PROMOTION • Need VERY large sample size • Algebraic correction
Promotion of Breastfeeding Intervention Trial (PROBIT) • Cluster-randomized trial at 31 sites in Belarus • Subjects 17,046 term singleton infants >2500g initially breastfed • Intervention: WHO/UNICEF “Baby Friendly Hospital Initiative” • Outcomes: BF @ 3,6,9,12 months and allergic, gastrointestinal and respiratory disease • F/U to 12 months on 16,491 (96.7%) Kramer MS, et al. JAMA 2001;285:413-20.
PROBIT, cont’d • RQ#1: Does a “Baby Friendly Hospital” increase exclusive breastfeeding? • Predictor = Group assignment • Outcome = Exclusive breast feeding • Intention-to-treat (ITT) analysis is fine • RQ#2: How much does exclusive breastfeeding reduce the risk of atopic eczema in the infant? (What is NNEBF*? ) • Predictor = Exclusive breast feeding • Outcome = Atopic eczema • ITT won’t work -- too much misclassification *Number Needed to Exclusively Breast Feed
Results • Exclusive BF at 3 months (rounded) 40% vs 5%, P < 0.001) • Eczema 3.3% vs 6.3%; adjusted OR = 0.54 (95% CI 0.31-.95 based on GLIMMIX) • Question: if the risk difference and risk ratio in this study are 3% and 0.54, what can we say about the values for exclusive breast feeding (as opposed to treatment allocation)?
Question: • What is the true effect of breast feeding, undiluted by misclassification bias? • Might be relevant for helping a working mother decide whether to breastfeed exclusively. (NNEBF)
Algebraic correction (simplified) 1 • Assume: • There is a rate of eczema for breast-fed infants (A) and a different rate for formula-fed infants (B) • These rates are not dependent on group assignment • Then if p1 and p2 are proportions breastfed in the intervention and control groups, the observed rates of eczema in the two groups, Ri and Rc are:RI = p1A + (1-p1)B RC= p2A + (1-p2)B
Algebraic correction (simplified) 2 • To obtain the risk difference, we first subtract the two equations: RI = p1A + (1-p1)B RC= p2A + (1-p2)B RC -RI =(p2-p1)A - (p2-p1)B RC -RI =(p2-p1)(A-B) B-A = (RC-RI)/(p1-p2) • So difference in risk of eczema for exclusive BF is: (6.3%-3.3%)/(40%-5%)= 8.6%
NNEBF and caveat • Since estimated risk difference is 8.6%, NNEBF to prevent 1 case of eczema is about 12 • Caveats: • Results are for the effect of breastfeeding in response to the intervention • Assumes the only effect of the Baby Friendly Hospital is via difference in exclusive breastfeeding • Similarly, effects of draft lottery only apply to those who served as a result of the lottery.
Summary/other examples • If variables known NOT to be associated with outcome are associated with treatment of interest, consider this approach. • Generalizes to many”natural experiments.” • E.g., an intervention is intermittently available, or only available to certain groups. -- different outcome by day of the week, etc.
More natural experiments: • Costs of discontinuity of care: increased laboratory test ordering in patients transferred to a different team the next morning* • Effect of ER Copay: rate of appendicitis perforation unchanged after increase in co-pay.** • Aircraft cabin air recirculation and symptoms of the common cold: no difference by type of air recirculation in aircraft *** * Help me find this article! It was from a VA **Hsu J, et al. Presented at Bay Area Clinical Research Symposium 10/17/03 ** Zitter JN et al. JAMA 2002;288:483-6
Unrelated variables to estimate bias or confounding • Measure an outcome that WOULD be affected by bias, but not by intervention (and see if it is) • Measure a predictor that WOULD cause the same bias as the predictor of interest (and see if it does)
Observational study of screening sigmoidoscopy • Possible bias: patients who agree to sigmoidoscopy are likely to be different • Solution: measure an outcome that would be similarly affected by bias • Results: • Decreased deaths from cancers within the reach of the sigmoidoscope (OR= 0.41) • No effect on deaths from more proximal cancers (OR= 0.96). Selby et al, NEJM 1992;326:653-7
Effect of British “breathalyser” crackdown • Abrupt drop in accidents occurring during weekend nights (when pubs are open) • Measure an outcome that would be affected by bias: accidents during other times • Result: No change in accidents occurring during other hours See Cook and Campbell: Quasi-Experimentation.Boston:Houghton Mifflin, p. 219
Calcium Channel Blockers (CCB) and AMI • Population based case-control study at Group Health • Progressive increase in risk of AMI with higher doses of CCB (P <0.01) • Concern: confounding by indication • Measure a predictor that would cause same bias: beta-blockers: • Result: progressive decrease in risk associated with higher doses of beta-blockers (P =0.04) Psaty et al., JAMA 1995;274:620-25
Suicide Risk in Bipolar Disorder During Treatment With Lithium and Divalproex • Retrospective cohort study of Kaiser Permanente and Group Health patients with bipolar disorder • Compared with no treatment, patients treated with Valproex 2.1 time suicide risk • Concern: confounding by indication • Results: Suicides per 1000 person/years • 31.3 for treatment with divalproex • 15 for no treatment (P<0.001) • 10.8 for Lithium (P<0.001) • If confounding by indication, expect same bias for Lithium Goodwin et al. JAMA. 2003;290:1467-1473
Initial Mood Stabilizer Prescription by Year of Initial Diagnosis Goodwin et al. JAMA. 2003;290:1467-1473
Estimating biases: Cautionary Tale • Nurses’ Health Study* • Vitamin E assoc. with decreased risk of CHD (RR ~.6) • No significant effect of multiple vitamins • Health Professionals Study** • Vitamin E assoc. with decreased risk of CHD (RR ~.6) • No significant effect of Vitamin C * N Engl J Med. 1993 May 20;328:1444-9 ** N Engl J Med. 1993 May 20;328:1450-6.
Propensity Scores -1 Big picture: want to know if association between treatment and outcome is CAUSAL Recall competing explanation = confounding by indication for treatment: Factor must be associated with outcome Factor must be associated with treatment Traditional approach: adjust for factors associated with outcome
Propensity Scores -2 Alternative approach: Create a new variable, propensity to be treated with the intervention Then match, stratify, or include it in multivariable analyses Advantages: Better power to control for covariables (because receipt of the intervention may be much more common than occurrence of the outcome) You can more easily tell when treated and untreated groups are not comparable
Propensity to receive treatment Propensity to receive treatment Propensity to receive treatment 1 1 1 C 0 0 0 Treated Treated Not Treated Not Treated Treated Not Treated www.chrp.org How Much Overlap In The Propensity Scores Do We Want? A B
Example: Aspirin use and all-cause mortality among patients being evaluated for known or suspected Coronary Artery Disease RQ: Does aspirin reduce all-cause mortality in patients with coronary disease Design: Cohort study Subjects: 6174 consecutive patients getting stress echocardiograms Predictor: ASA use Outcome: All-cause mortality JAMA 2001; 286: 187
Analysis using Propensity Scores Two multivariable analyses: Predictors of aspirin use Predictors of death Predictors of ASA use turned into a propensity score Users and non-users of ASA matched on ASA propensity score
Survival in Propensity-Matched Patients Recall total N=6174
Limitations • Can only compare subjects whose propensity scores overlap • Can only generalize to subjects who could have received either treatment • Important variables may be missing from your model
Illustration: Phototherapy for Neonatal Jaundice • RQ: How effective is phototherapy in babies with TSB 20-22.9 mg/dL? • Subjects: Newborns at NC-KPMCP ≥ 2000 g, ≥ 34 wks with TSB 20-22.9 mg/dL at ≥ 48 hr (N=1777) • Intervention: Phototherapy within 8 hours of TSB 20-22.9 mg/dL (N=635, 36%) • Outcome TSB ≥ 25 mg/dL (N=21, 1.2%)
Logistic regression • Phototherapy only: OR=0.30 (P = .05) • Phototherapy + gest age: OR = 0.28 (P=0.04) • Phototherapy + gest age + rate of rise:OR = 0.12 (P=.002)
Propensity analysis • Step 1: predictors of PT within 8 hr oif TSB 20-22.9 • Rate of rise of TSB, gestational age, race, sex, maternal age, hospital of birth, etc. • Generate new variable, propensityPT= predicted probability of PT
Logistic Regression With Propensity Score • Phototherapy only: OR=0.30 (P = .05) • Phototherapy + gest age: OR = 0.28 (P=0.04) • Phototherapy + gest age + rate of rise:OR = 0.12 (P=.002) • Phototherapy + propensity scoreOR= 0.13 (P=.002)
Efficacy of Phototherapy (PT) for Neonatal Jaundice • Large interfacility practice variation in use of phototherapy in the NC KPMCP • Hospital of birth thus an IV for phototherapy use • We can use individual-level data to adjust for other risk factors for TSB ≥ 20 mg/dL
Instrumental variable • N too small for IV for TSB ≥ 25 mg/dL, so predict TSB ≥ 20 mg/dL • For each hospital, calculate the proportion of newborns in group C (“AAP consider PT group”) who received phototherapy • Use this proportion as a predictor of TSB ≥ 20 mg/dL in individual level analyses
Group R: AAP RECOMMENDS phototherapy Group C: AAP says “CONSIDER” phototherapy Atkinson L, Escobar G, Takayama J, Newman TB. Pediatrics 2003;111:e555-61
Rate of hyperbilirubinemia by PT use in 11 hospitals, 1995-6