Download
1 / 83
830 likes | 848 Views
Global Climate Change. 1 year. 100 years. 10,000 years. 24 hours. 10 years. 1000 years. 100,000 years. Introduction - Climate scale. 1 day – diurnal cycle Weather occurs on an hourly or daily basis Primary cause: Rotation of the Earth on it’s axis Yesterday’s weather was:. 1

E N D
1 year 100 years 10,000 years 24 hours 10 years 1000 years 100,000 years Introduction - Climate scale • 1 day – diurnal cycle • Weather occurs on an hourly or daily basis • Primary cause: Rotation of the Earth on it’s axis • Yesterday’s weather was:
1 year 100 years 10,000 years 24 hours 10 years 1000 years 100,000 years Introduction - Climate scale • 1 year – yearly cycles • Equinoxes and solstices. • 23.5 degree tilt of the Earth’s axis • Last year:
1 year 100 years 10,000 years 24 hours 10 years 1000 years 100,000 years Introduction - Climate scale • 10 years – decadal scale • Longer-term variabilities begin to appear • El Niño & La Niña • Rapid climatic shifts can occur • Last 10 years: • El Niño & La Niña • Summary of 10 Year Time Scale (National Climate Data Center)
1 year 100 years 10,000 years 24 hours 10 years 1000 years 100,000 years Introduction - Climate scale • What is El Niño? • Basically, it's a giant puddle (or pod) of heated water that sloshes across the Pacific Ocean • Similar to an iceberg • Bulge on the surface • Most of “pod” beneath the surface • Due to difference in density • National Geographic’s Model
1 year 100 years 10,000 years 24 hours 10 years 1000 years 100,000 years Introduction - Climate scale • What is El Niño? • Normal conditions in the tropical Pacific Ocean • Surface winds move from east to west • From high pressure in S. America to low pressure in Australia • Drags water westward • Warm water pools in the western Pacific
1 year 100 years 10,000 years 24 hours 10 years 1000 years 100,000 years Introduction - Climate scale • What is El Niño? • Every 3 – 8 years, system reverses • Called the Southern Oscillation • Trade winds weaken or reverse • Warm water migrates from Australia to S. America • Arrives in time for Christmas – Corriente del Niño
1 year 100 years 10,000 years 24 hours 10 years 1000 years 100,000 years Introduction - Climate scale • ENSO - El Niño-Southern Oscillation • Typically lasts 1 year • May last up to 3 • In multi-year events, first year not as affected • Affects both hemispheres
1 year 100 years 10,000 years 24 hours 10 years 1000 years 100,000 years Introduction - Climate scale • Recognizing an El Niño • Sea Surface Temperatures (SST) • Normal: 6-8° C warmer in the western tropical Pacific than in the eastern tropical Pacific • Check SST to see if in “normal” range
1 year 100 years 10,000 years 24 hours 10 years 1000 years 100,000 years Introduction - Climate scale • La Niña • Return to “normal” conditions from an El Niño strong • Produces: • Strong currents • Powerful upwelling • Chilly and stormy conditions along S. American coast • Eastern Pacific cools rapidly, Western Pacific warms rapidly • Renewed Trade Wind activity spreads the cooler eastern Pacific waters westward
1 year 100 years 10,000 years 24 hours 10 years 1000 years 100,000 years Introduction - Climate scale • 100 years – Centennial scale • Paleoclimatic data to track solar and ocean variability • Large scale climatic changes and variability • Pacific Decadal Oscillation (PDO) & North Atlantic Oscillation (NAO)
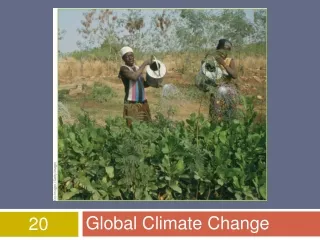
1 year 100 years 10,000 years 24 hours 10 years 1000 years 100,000 years Introduction - Climate scale • 100 years – Centennial scale • Last 100 years: • Human population and CO2 levels rose exponentially • Climate related events severely impacts human populations • Summary of 100 Year Time Scale
Occurs every 15 – 20 and 50 – 70 years Coincides with ENSO
The Past 100 Years: The 20th Century's Human Climate Conundrum
1 year 100 years 10,000 years 24 hours 10 years 1000 years 100,000 years Introduction - Climate scale • 1,000 years • Variability in • Carbon cycles on land and sea • Thermohaline current • Last 1,000 years • Europe’s “Little Ice Age” • Large Volcanic Eruptions • Multi-decadal droughts
National Ice Core Laboratory (http://nicl.usgs.gov/proc.htm )
1 year 100 years 10,000 years 24 hours 10 years 1000 years 100,000 years Introduction - Climate scale • 10,000 years • Natural cycles begin to appear • Those not influenced by humans • Use Paleoclimatic data
1 year 100 years 10,000 years 24 hours 10 years 1000 years 100,000 years Introduction - Climate scale • 10,000 years • Last 10,000 years • End of last Ice Age • Melting of polar ice caps and glaciers • Rising sea level • Formation of the Black Sea, Pleistocene Lakes in Western U.S.
Did the influx of freshwater 8,200 years ago from large lakes in what is now northern Canada help trigger the coldest climate event in the Earth's climate system in the past 10,000 years?
1 year 100 years 10,000 years 24 hours 10 years 1000 years 100,000 years Introduction - Climate scale • 100,000 years • Extreme long term trends • Milankovitch cycles • Last 100,000 years • Last Ice Age cycle 60,000 to 20,000 ybp • Ice Age Cycles began ~2.6 myo to present • Decline of the Neanderthal, rise of Homo sapiens
Causes of Global Climate Change • Global Cooling • Volcanic Eruptions • Tambora, Indonesia – 1815 “year without a summer” • Mount Toba, present day Sumatra - 73,000 years ago accelerated glaciation
Causes of Global Climate Change • Milankovitch cycles • Eccentricity – 100,000 to 400,000 year periods • Obliquity – every 41,000 years • Processional of equinoxes – every 23,000 years
Eccentricity: The Shape of the Earth’s Orbit • Shape of Earth’s orbit changes from circular to elliptical over 100,000 years. • More circular: stable climate • More elliptical: strong climate variations
Eccentricity t warmer cooler
Obliquity: Tilt of Earth’s Axis • The degree to which the axis tilts varies from 21.5͍° to 23.5° over 41,000 years • More tilt: poles receive more sunlight • Less tilt: poles receive less sunlight
Precession of the equinoxes • As the Earth spins, it wobbles a bit • N Pole currently points towards Polaris (the North Star) but shifts to point towards Vega over 23,000 years
Causes of Global Climate Change • Global Cooling • Changes in ocean circulation • Changes to Thermohaline current • Position of the continents
THE GLOBAL OCEAN CONVEYOR—The global ocean circulation system, often called the Ocean Conveyor, transports heat throughout the planet. White sections represent warm surface currents. Purple sections represent deep cold currents. (Illustration by Jayne Doucette, WHOI)
DRAMATIC CHANGES IN THE NORTH ATLANTIC—Subpolar seas bordering the North Atlantic have become noticeably less salty since the mid-1960s, especially in the last decade. This is the largest and most dramatic oceanic change ever measured in the era of modern instruments. This has resulted in a freshening of the deep ocean in the North Atlantic, which in the past disrupted the Ocean Conveyor and caused abrupt climate changes. (B. Dickson, et. al., in Nature, April 2002)
DRAMATIC CHANGES IN THE NORTH ATLANTIC—Subpolar seas bordering the North Atlantic (top) have become noticeably less salty since the mid-1960s, especially in the last decade (bottom). This is the largest and most dramatic oceanic change ever measured in the era of modern instruments. This has resulted in a freshening of the deep ocean in the North Atlantic, which in the past disrupted the Ocean Conveyor and caused abrupt climate changes. (B. Dickson, et. al., in Nature, April 2002)
A LONG RECORD OF ABRUPT CLIMATE CHANGES • The Younger Dryas • about 12,700 years ago, average temperatures in the North Atlantic region abruptly plummeted nearly 5°C and remained that way for 1,300 years before rapidly warming again.
A LONG RECORD OF ABRUPT CLIMATE CHANGES • The 8,200-Year Event • A similar abrupt cooling occurred 8,200 years ago. • It was not so severe and lasted only about a century. • But if a similar cooling event occurred today, it would be catastrophic.
A LONG RECORD OF ABRUPT CLIMATE CHANGES • The Medieval Period • An abrupt warming took place about 1,000 years ago. • It was not nearly so dramatic as past events, but it nevertheless allowed the Norse to establish settlements in Greenland.
A LONG RECORD OF ABRUPT CLIMATE CHANGES • The Little Ice Age • The Norse abandoned their Greenland settlements when the climate turned abruptly colder 700 years ago. • Between 1300 and 1850, severe winters had profound agricultural, economic, and political impacts in Europe.
What Happens if the Conveyor Shuts Down? • Scenario 1: Conveyor slows down within next two decades. • Such a scenario could quickly and markedly cool the North Atlantic region, causing disruptions in global economic activity. • These disruptions may be exacerbated because the climate changes occur in a direction opposite to what is commonly expected, and they occur at a pace that makes adaptation difficult. Source: Abrupt Climate Change: Should We Be Worried? By Robert B. Gagosian <http://www.whoi.edu/institutes/occi/viewArticle.do?id=9986>
What Happens if the Conveyor Shuts Down? • Scenario 2: Conveyor slows down a century from now. • In such a scenario, cooling of the North Atlantic region may partially or totally offset the major effects of global warming in this region. • Thus, the climate of the North Atlantic region may rapidly return to one that more resembles today’s—even as other parts of the world, particularly less-developed regions, experience the unmitigated brunt of global warming. • If the Conveyor subsequently turns on again, the “deferred” warming may be delivered in a decade Source: Abrupt Climate Change: Should We Be Worried? By Robert B. Gagosian <http://www.whoi.edu/institutes/occi/viewArticle.do?id=9986>