Download

1 / 9
90 likes | 208 Views
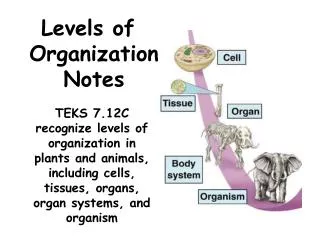
Atmospheric Circulation Response to Projected Changes in Arctic Sea Ice and Snow Cover Experiments with the “High Resolution” * NCAR Atmospheric General Circulation Model (CAM3) Clara Deser, Robert Tomas, Masha Tsukernik (NCAR) Michael Alexander (NOAA). * 1.4° latitude x longitude; 26 levels.

E N D
Atmospheric Circulation Response to Projected Changes in Arctic Sea Ice and Snow Cover Experiments with the “High Resolution”* NCAR Atmospheric General Circulation Model (CAM3)Clara Deser, Robert Tomas, Masha Tsukernik (NCAR) Michael Alexander (NOAA) * 1.4° latitude x longitude; 26 levels
Atmospheric Circulation Response to Projected Changes in Arctic Sea Ice and Snow Cover Experiments with the “High Resolution” NCAR Atmospheric General Circulation Model (CAM3)Clara Deser, Robert Tomas, Masha Tsukernik (NCAR) Michael Alexander (NOAA) • How big, and what pattern? • How important compared to greenhouse gas forcing? • Feedback on sea ice and snow cover?
Sea Ice Concentration from a Coupled Climate Model (CCSM3): 1980-1999 vs. 2080-2099 %
Sea Level Pressure Response(2080-2099 minus 1980-1999)(contoured every 1 hPa; shading for significance) Blue: SLP decrease Red: SLP increase
Sea Level Pressure Response(2080-2099 minus 1980-1999)(contoured every 1 hPa; shading for significance) Large response in fall, spring Small response in summer
Sea Level Pressure Response(2080-2099 minus 1980-1999)(contoured every 1 hPa; shading for significance) Large response in fall, spring Vertical structure: baroclinic in fall, barotropic in winter & spring Small response in summer
Atmospheric Circulation Response to Sea Ice vs.Response of Coupled Model to Anthropogenic Forcing Sea Level Pressure 2080-99 minus 1980-99 July-Sep Oct-Dec Coupled Model Atmospheric Model CCSM3 CAM3 Not much correspondence!
Atmospheric Circulation Response to Projected Changes in Arctic Sea Ice and Snow Cover NEXT STEPS • Sea ice forcing: impact of concentration vs. thickness? • Snow cover forcing: extent vs. depth? • Circulation response: role of intrinsic patterns? • How important compared to greenhouse gas forcing? • Coupled atmosphere-mixed layer ocean response? • Feedback on sea ice and snow cover?
Precipitation Response(2080-2099 minus 1980-1999)(contoured every 0.25 mm/day; shading for significance)